
-
$NEO
$NEO ~USD" api="cryptocompare.com" realtime="true" animation="backgroundRedGreen">’s latest analysis shows it has gained 60% by breaking above the previous support range. - The current chart shows that $NEO is trading at $22.66 and has increased by 10%.
- Examining the 4-hour technical chart, it is emphasized that the support range of $21.20 – $20.59 is important for $NEO and that the upward trend may continue with strong buying reactions at this level.
$NEO gained strength from the support levels determined in the previous analysis and rose to its current price of $22.66, targeting $25.
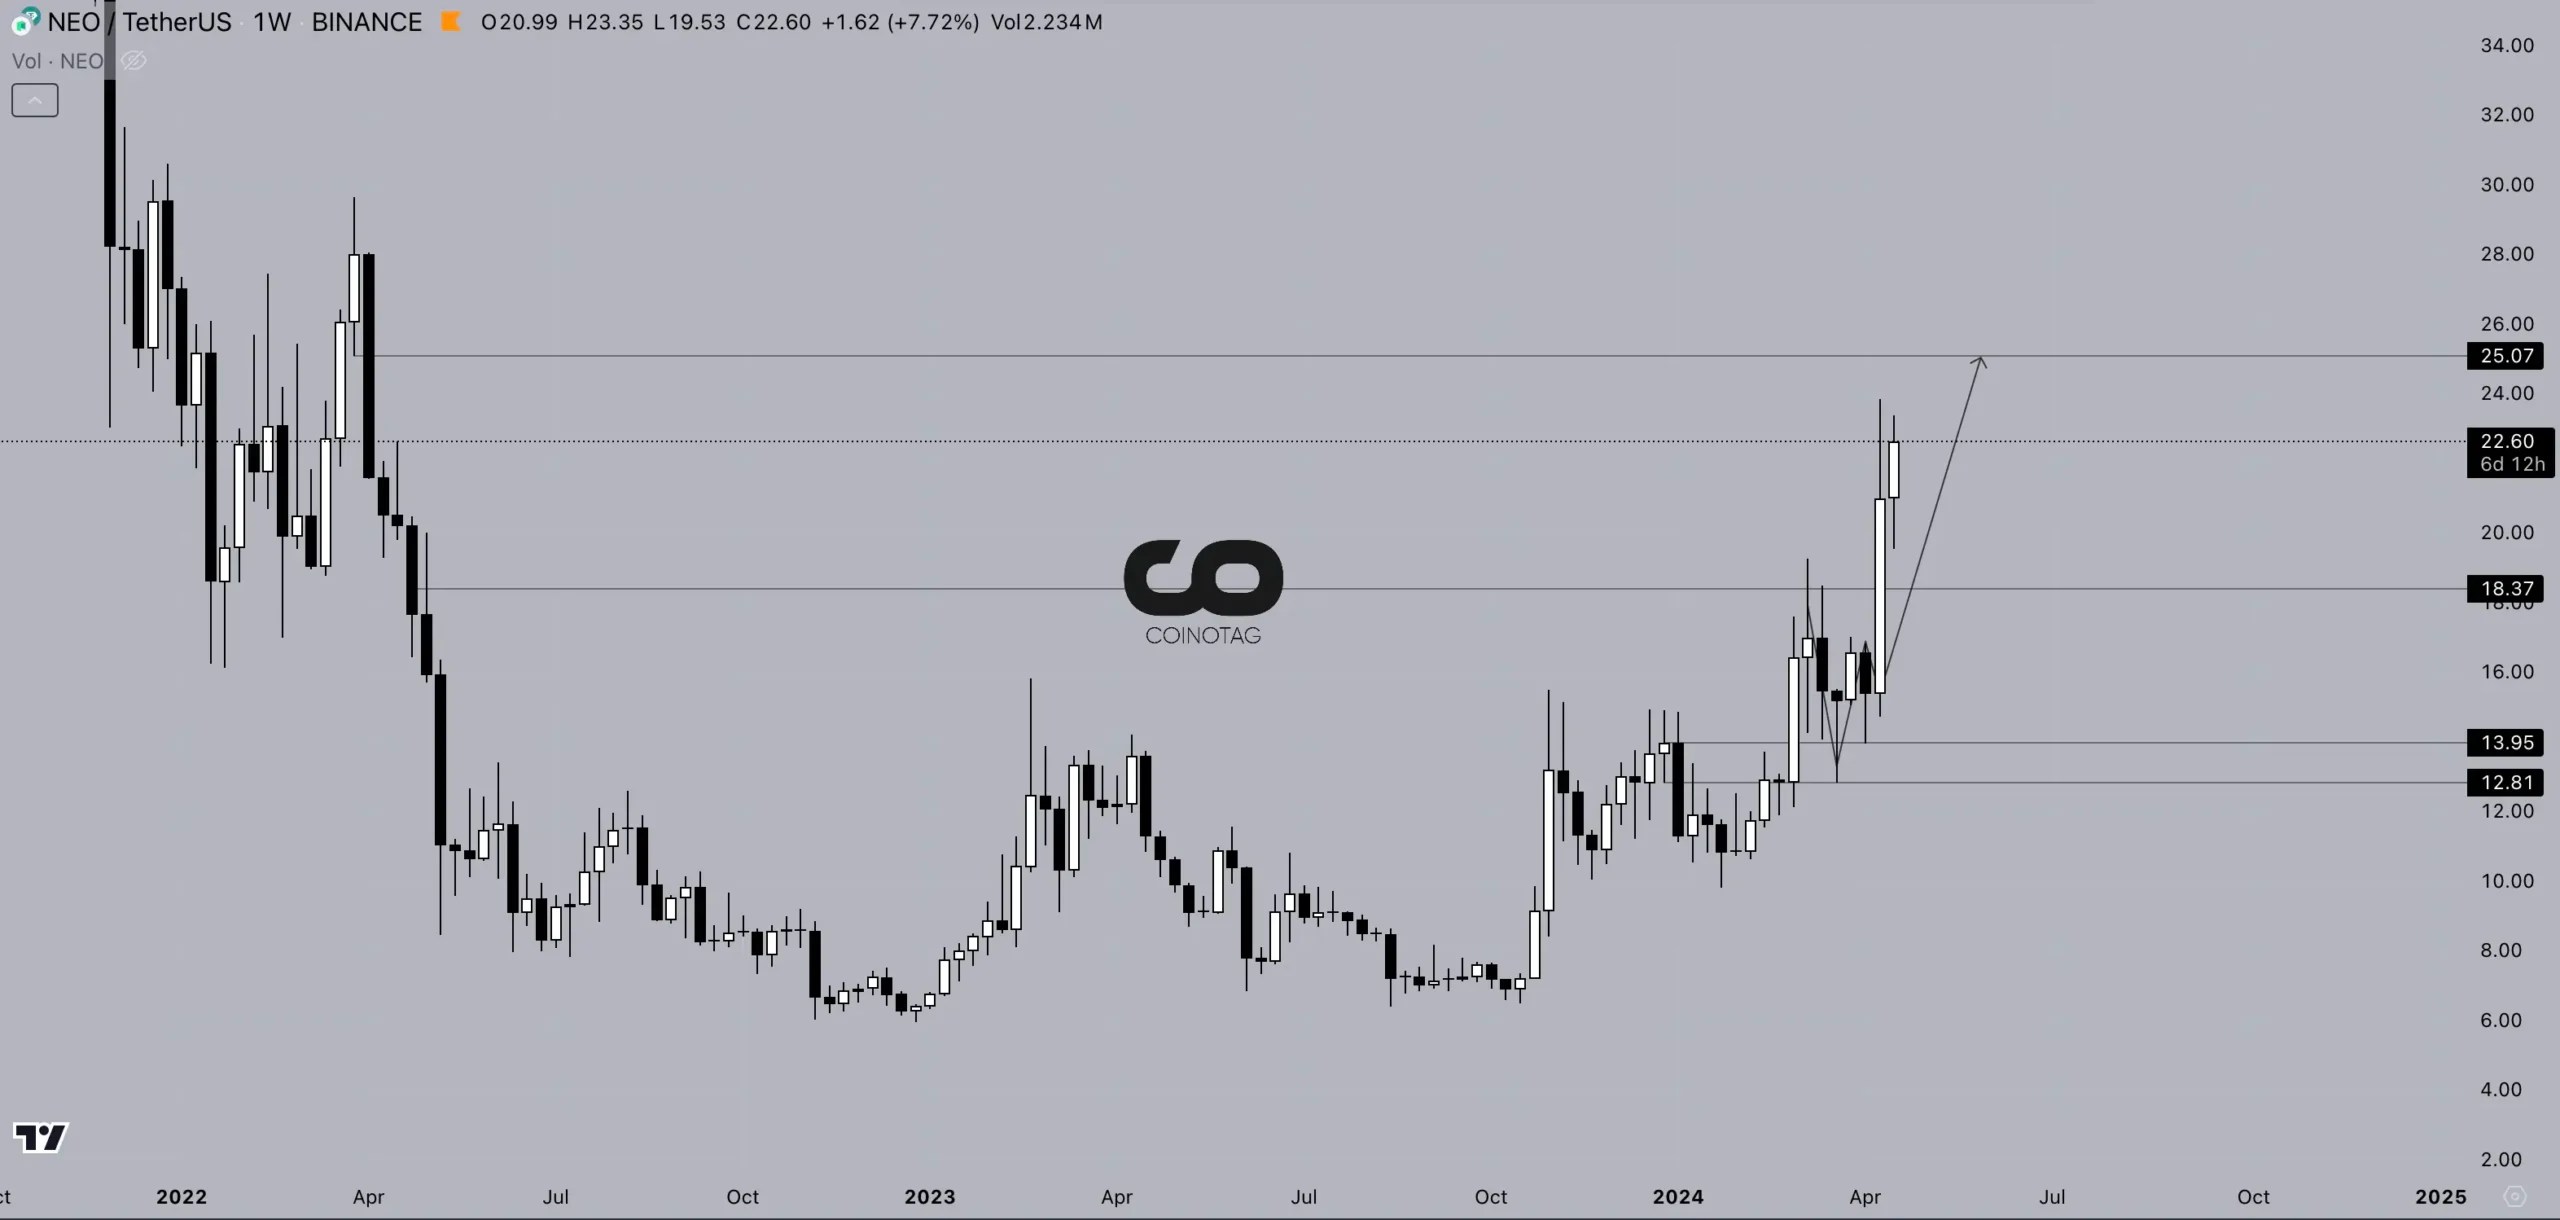
MEDIUM-TERM $NEO ANALYSIS
 $NEO/USD Analysis">
When examining $NEO’s current technical chart, the previous analysis was on March 23rd and we stated that the support range for spot purchases was $13.95 – $12.81. The $NEO coin started its upward trend after our last analysis and provided Coinotag readers with a 60% gain.
The $NEO coin is currently trading at $22.66 and has increased by 10% today. Looking at the current chart of the $NEO coin, it is seen that the upward target is $25.
As long as the $NEO coin stays above $18.37, its first target is $25 and its second target is $31.55.
SHORT-TERM $NEO ANALYSIS
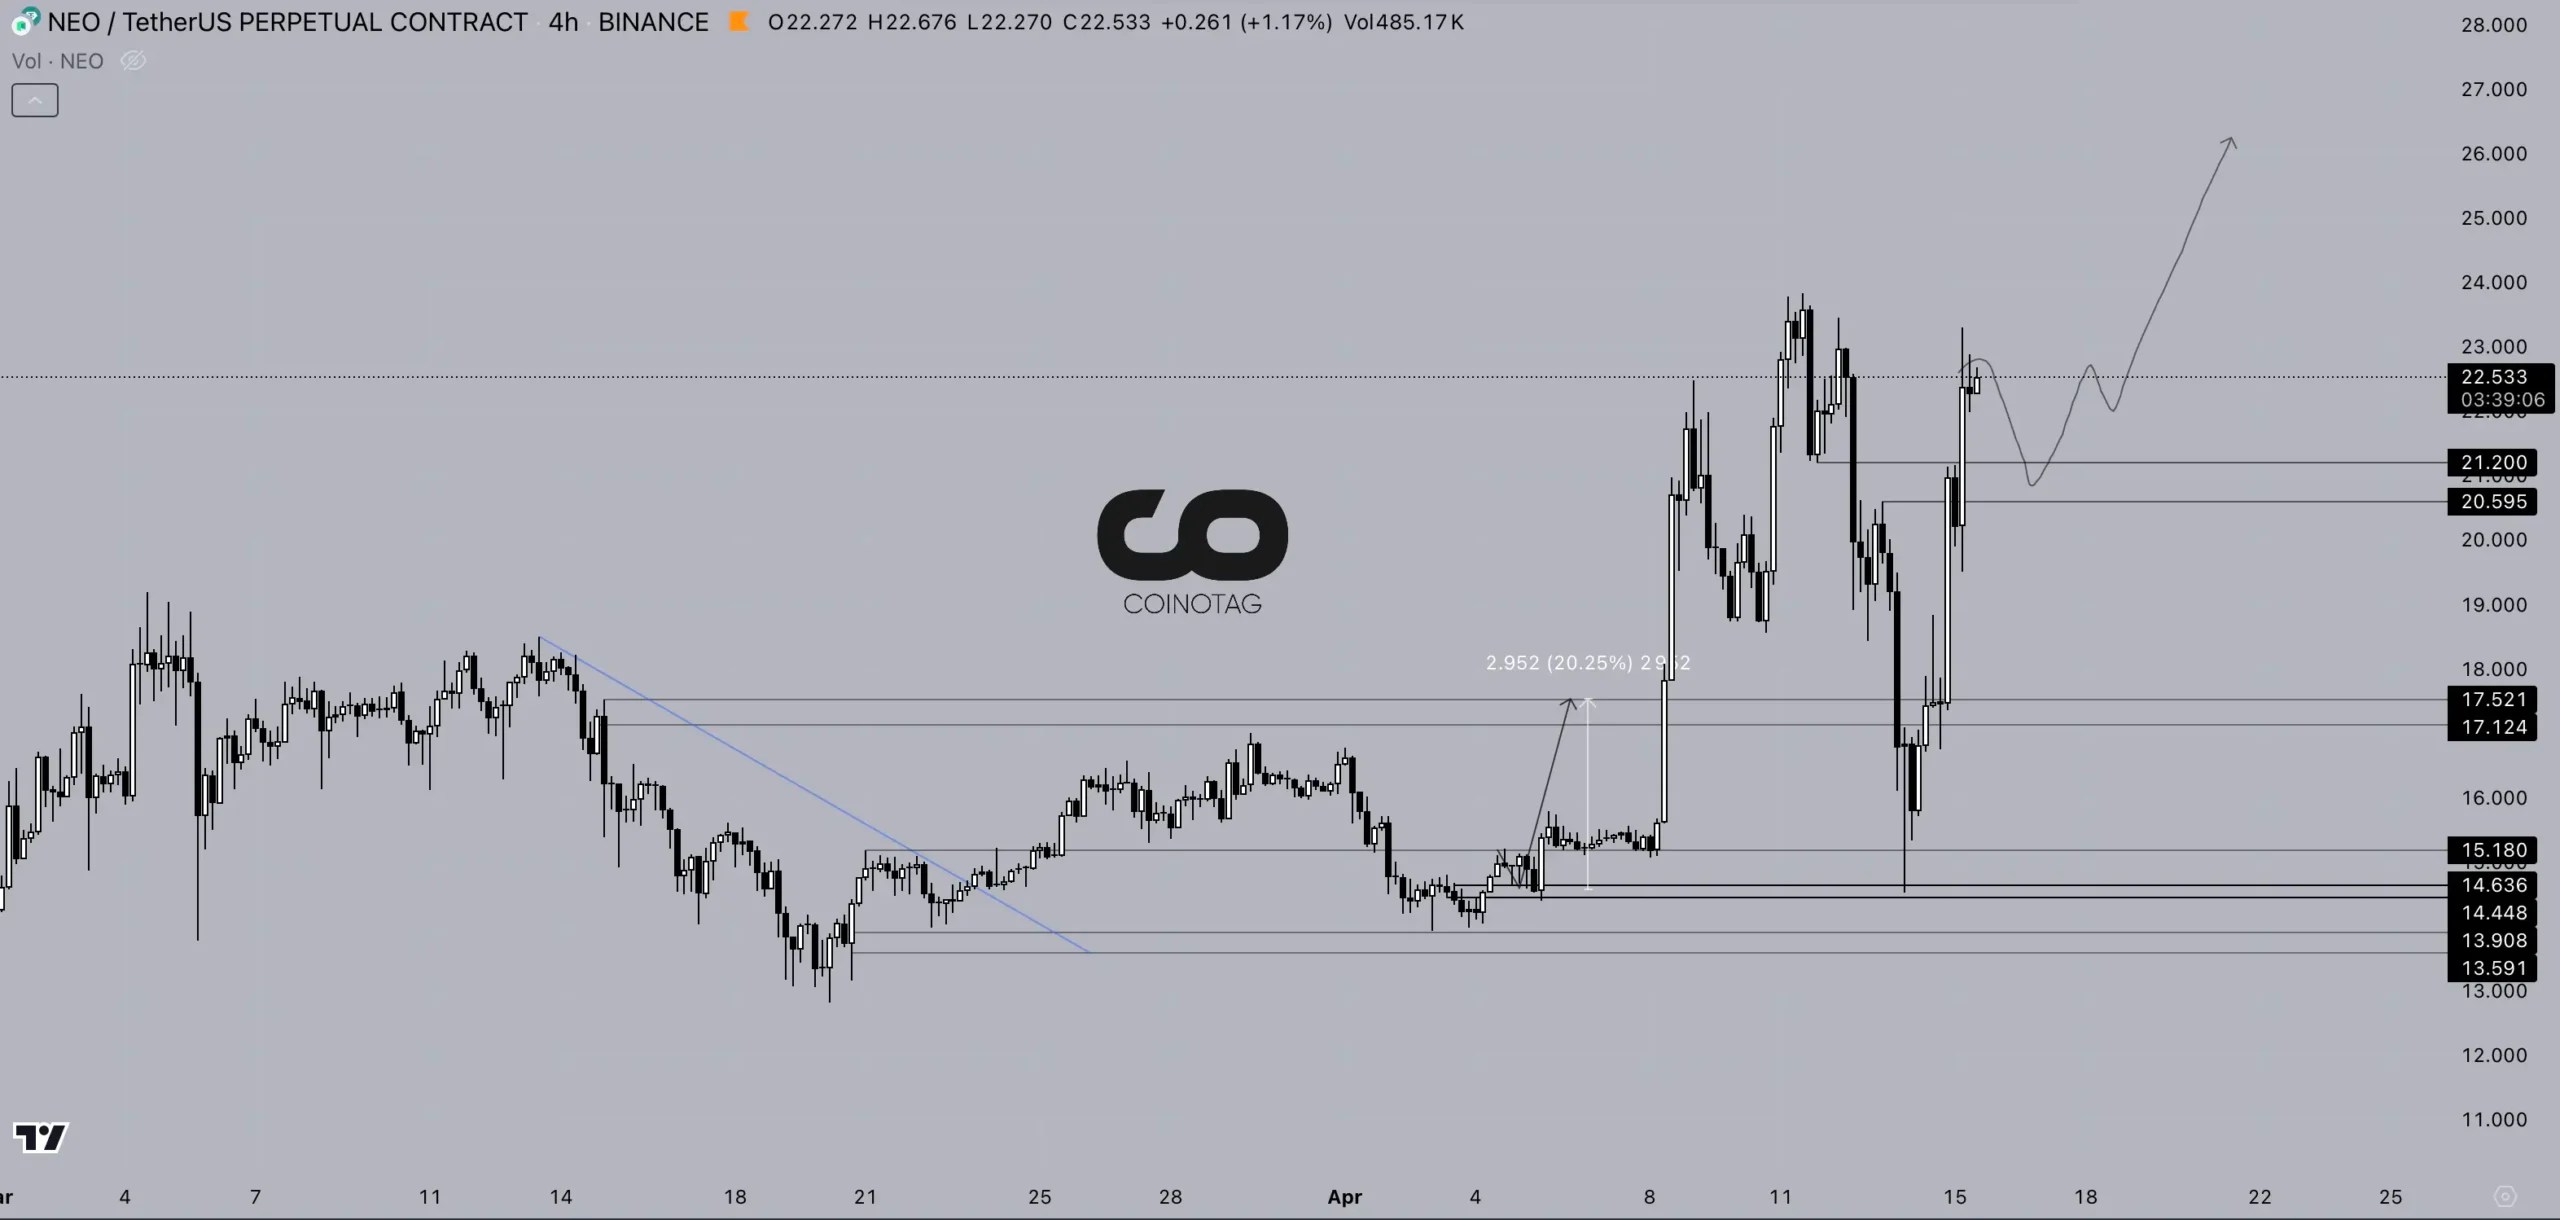
When examining the 4-hour technical chart of the $NEO coin, it is seen that the expected increase in the previous analysis has materialized. When evaluating the current chart, it is stated that attention should be paid to the support zone of **$21.20 – $20.59**.
If the $NEO coin encounters strong buying reactions in this support range, it may continue its upward trend to $28. However, if there is a decrease in the support range, confirmations should be waited before making long positions.
19.53 dollars is recommended as the stop-loss level in the support range suitable for swing long transactions.