
The Litecoin ($LTC) price currently displays bullish signals against Bitcoin, prompting speculation about a potential significant upward movement for $LTC.
However, despite these promising indicators, the initial trends observed this month have leaned towards bearishness. As such, while the possibility of a sharp increase in the $LTC price looms should the bullish signals intensify, the current market conditions suggest a cautious approach.
Litecoin’s Rough Month: Down 37.3% Amid Market Turbulence
The Litecoin price has experienced a notable decline of over 37.3% this month, following a local peak of around $113. $LTC is hovering around the golden ratio support level at approximately $80, offering a potential opportunity for a bullish rebound.
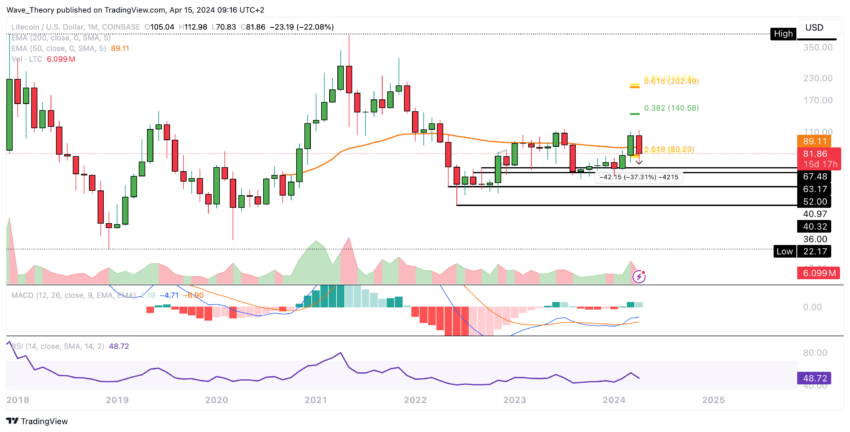
Additionally, the Moving Average Convergence Divergence (MACD) lines have formed a bullish crossover on the monthly chart. However, the MACD histogram is beginning to trend lower bearishly, while the Relative Strength Index (RSI) is situated in neutral territory.
Read More: How To Buy Litecoin ($LTC) and Everything You Need To Know
Weekly Chart Analysis: The Golden Ratio as a Strong Support Level
Last week, the $LTC price initially dipped below the Golden Ratio support level of around $80. However, the price had precisely returned to this critical support level by the week’s close.
This suggests a potential for an upward movement in the current week. Nevertheless, the MACD histogram on the weekly chart indicates bearish signals since the previous week.
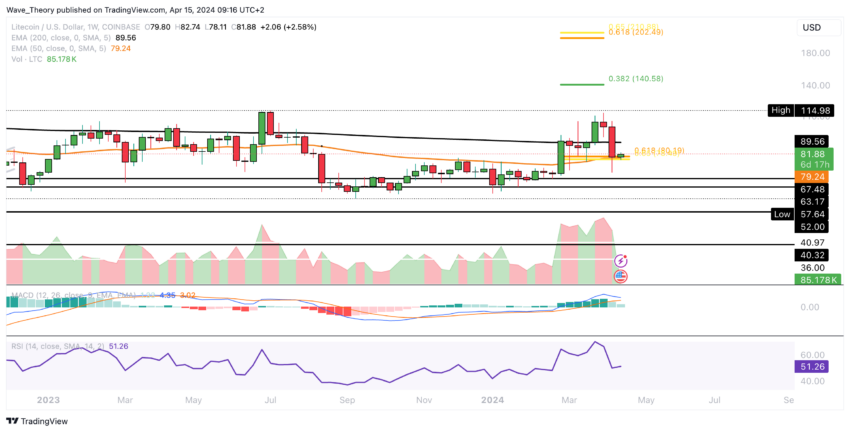
This implies a possible bearish crossover of the MACD lines in the near future. Moreover, the Exponential Moving Averages (EMAs) exhibit a death cross pattern on the weekly chart, indicating a bearish trend in the medium term.
Meanwhile, the RSI remains neutral territory, offering no clear indications of bullish or bearish momentum.
Litecoin’s Positive Signal: Golden Crossover Remains in Daily Chart
In Litecoin’s daily chart, a golden crossover persists, indicating a sustained bullish trend in the short to medium term. However, there has been a recent bearish crossover of the MACD lines.
Simultaneously, the MACD histogram shows bullish momentum today, while the RSI remains neutral. Two key hurdles lie ahead for $LTC’s trajectory.
The first resistance sits around $89.4, coinciding with the 50-day EMA. Additionally, significant Fibonacci resistance looms around $97.
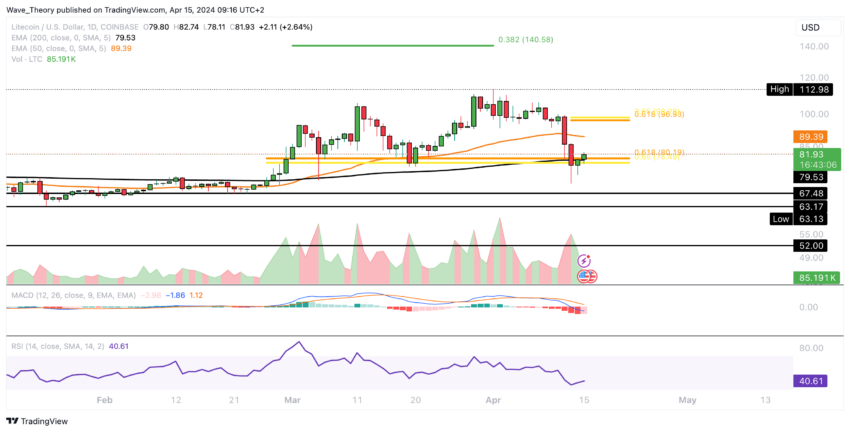
A breach beyond the golden ratio at $97 would signify the completion of the corrective phase, potentially paving the way for $LTC to target the 0.382 Fib resistance at approximately $140.
Conversely, should $LTC experience downward pressure, substantial support is anticipated between $63 and $67.5.
Bearish Signal: Litecoin’s 4H Chart Shows Death Cross Formation
An upward trajectory towards the Golden Ratio level at approximately $97 suggests a potential increase of around 18%. Notably, the MACD lines in the 4H chart have recently crossed bullishly, accompanied by a bullish uptick in the MACD histogram.
Meanwhile, the RSI remains in neutral territory. Short-term prospects favor a bullish trend.
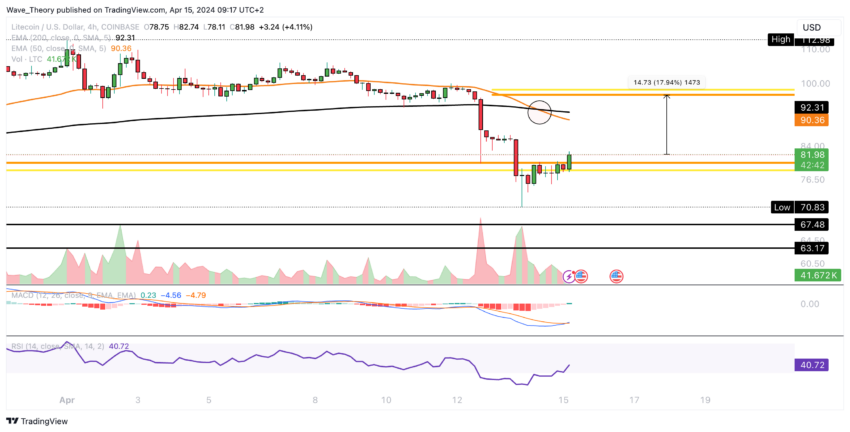
However, it’s essential to recognize that the trend has already been confirmed as bearish by the EMAs’ death cross, emphasizing the ongoing corrective phase.
Read More: Litecoin ($LTC) Price Prediction 2024/2025/2030
Litecoin vs. Bitcoin: Emerging Silver Lining in Price Dynamics
Despite the significant downward trend in $LTC price against Bitcoin, there are indications of a potential reversal. Notably, the MACD lines exhibit a bullish crossover on the weekly chart, while the RSI indicates a bullish divergence.
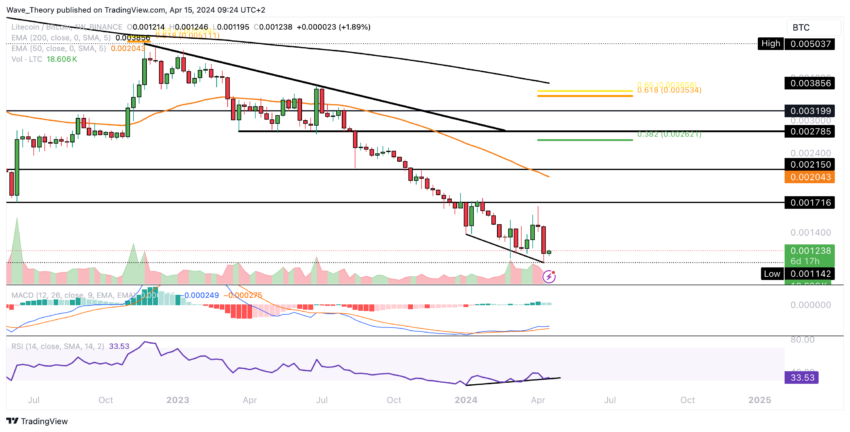
Should Litecoin commence an upward trajectory, it will encounter substantial resistance levels between approximately 0.001716 $BTC and 0.00215 $BTC. Additionally, the 50-week EMA presents a formidable barrier around 0.00204 $BTC.