Today’s market session started with a slight bullish recovery, as several tokens posted gains. Despite this, the market cap is still 5.7% down from its previous 24-hour price, as the trading volume jumped by 18% to stand at $166.4B as of the same period.
Bitcoin Price Review
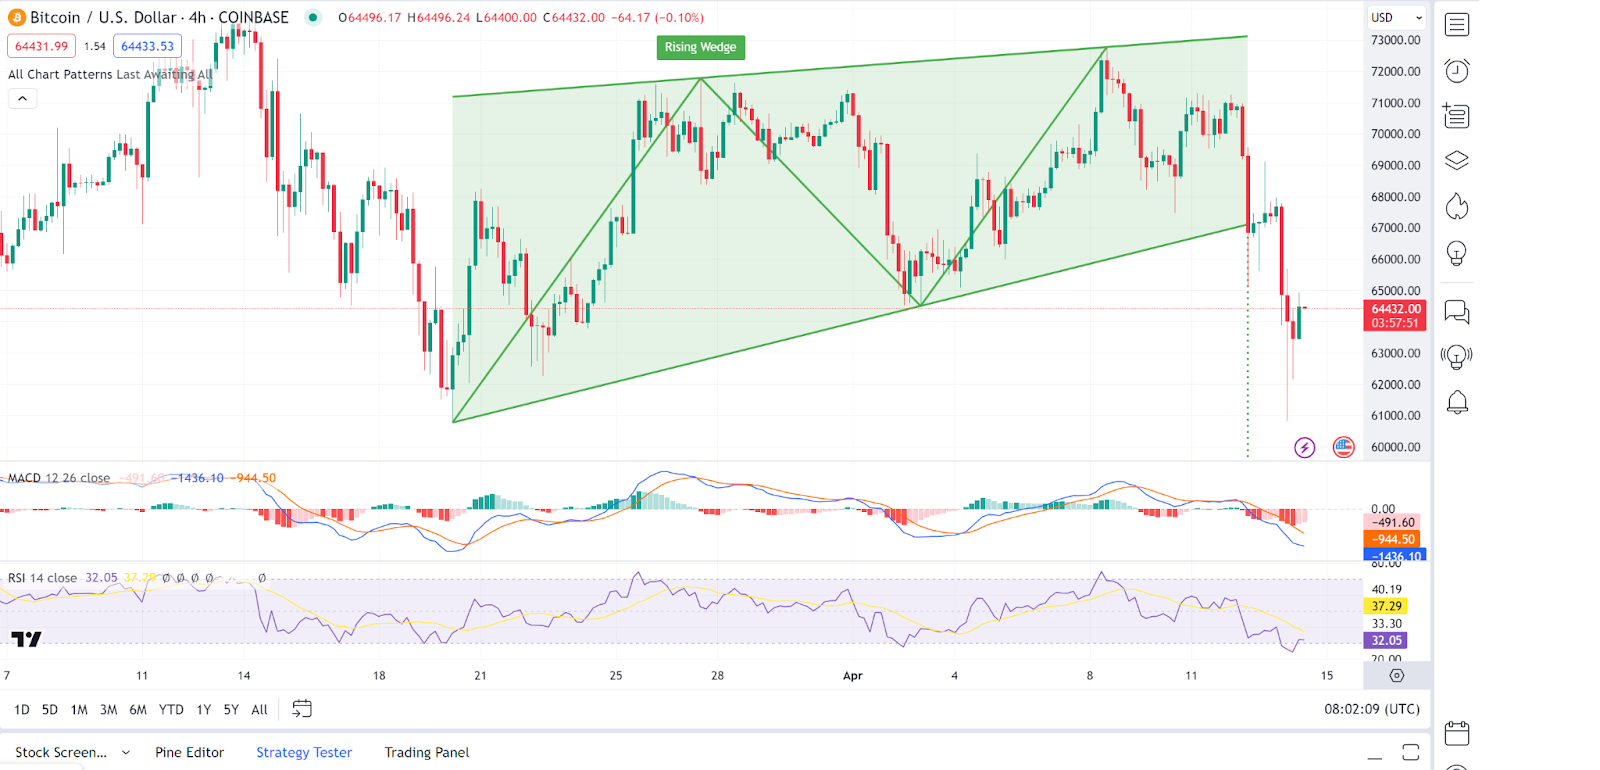
Bitcoin ($BTC) is still down despite today’s recovery, trading at the $64K level. I’ll perform a technical analysis on each of the provided charts. This chart shows a bearish movement after forming a rising wedge pattern, typically considered a bearish pattern in technical analysis. The Bitcoin price has broken down from the wedge, indicating a potential downtrend continuation.
The Moving Average Convergence Divergence (MACD) is negative and appears to be widening, which can be interpreted as increasing bearish momentum. The Relative Strength Index (RSI) is not in the oversold territory, suggesting there might still be room for downward movement. As of press time, the Bitcoin price stood at $64,650, representing a 3.8% dump from its previous 24-hour price.
Ethereum Price Review
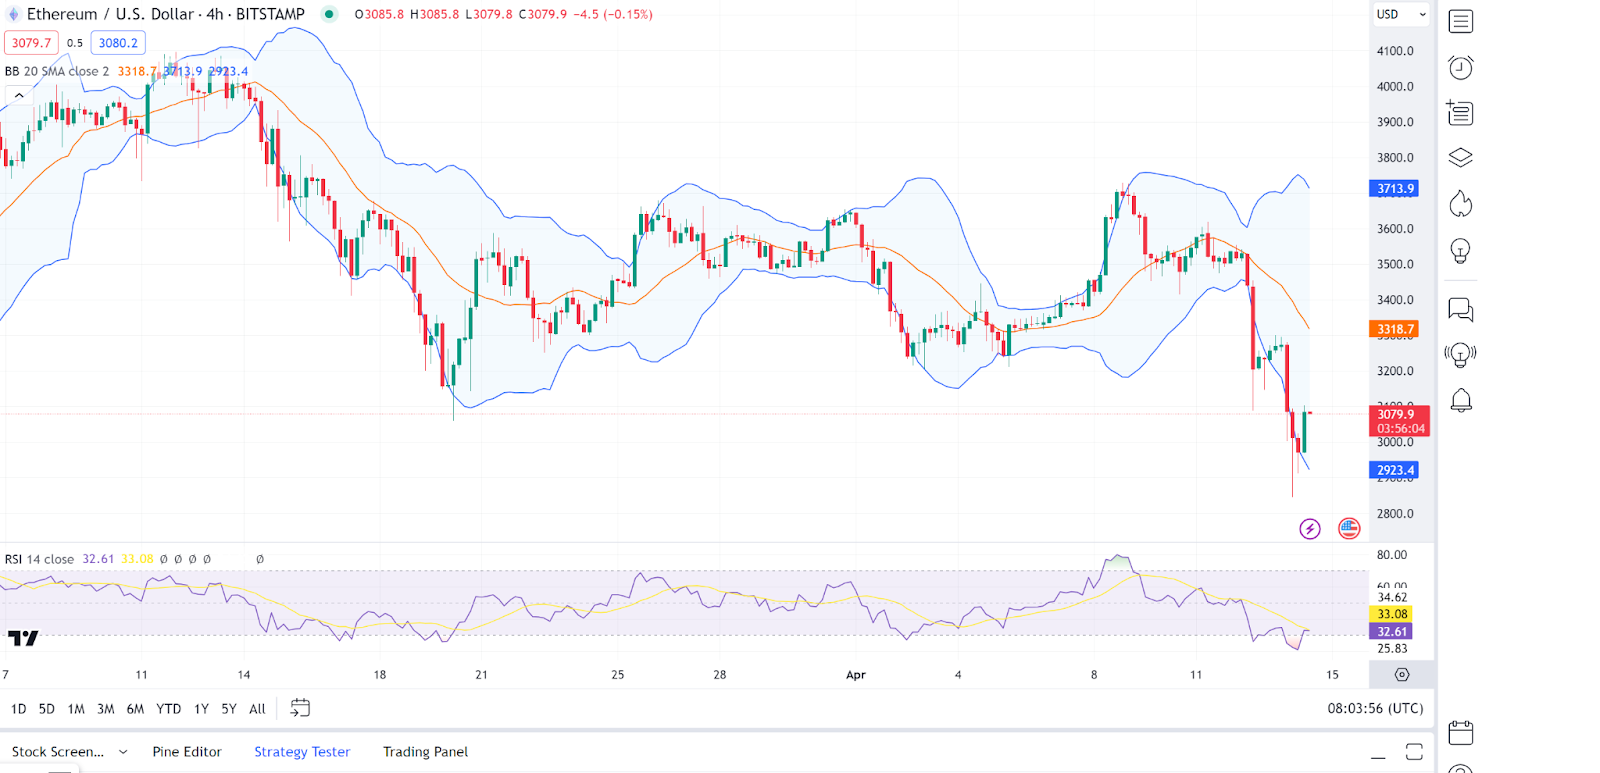
Ethereum ($ETH) is also in a consolidation period as indicated by its price movements today. The Ethereum chart indicates a solid downward trend as the price action has broken below the Bollinger Bands, moving significantly away from the moving average, which usually signals high volatility and strong momentum.
The RSI is approaching the oversold area, indicating that the asset may become undervalued, which could lead to a potential reversal or pullback in the near future. However, the trader should watch for a bounce as the RSI enters the oversold territory. As of press time, the Ethereum price stood at $3,083, representing a 5.3% dump from its previous 24-hour price.
Celestia Price Review
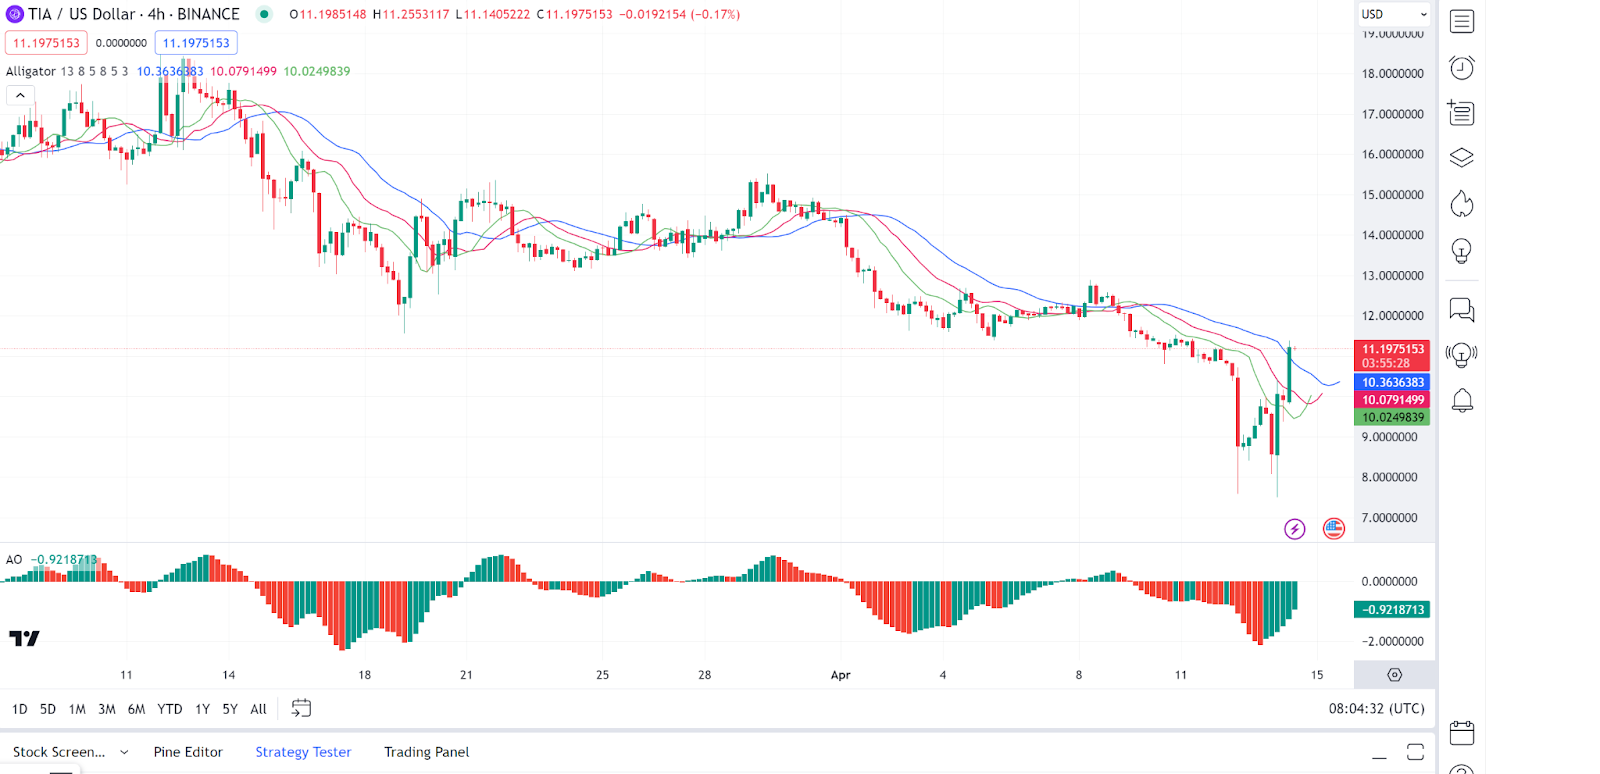
Celestia ($TIA) is today’s top gainer as the altcoin shows tremendous recovery in today’s session. Celestia charts present a neutral to bearish trend with the price weaving through the moving average lines. The Alligator indicator shows a bearish crossover with the green line (lips) below the red (teeth) and blue (jaw), indicating a potential further decrease in price.
The Awesome Oscillator is showing red bars, which also suggests bearish momentum. However, it’s important to note that the AO bars are becoming smaller, which might point to a decrease in downward momentum. As of press time, the Celestia price stood at $11.59, representing a 22.8% pump from its previous 24-hour price.
Flare Price Analysis
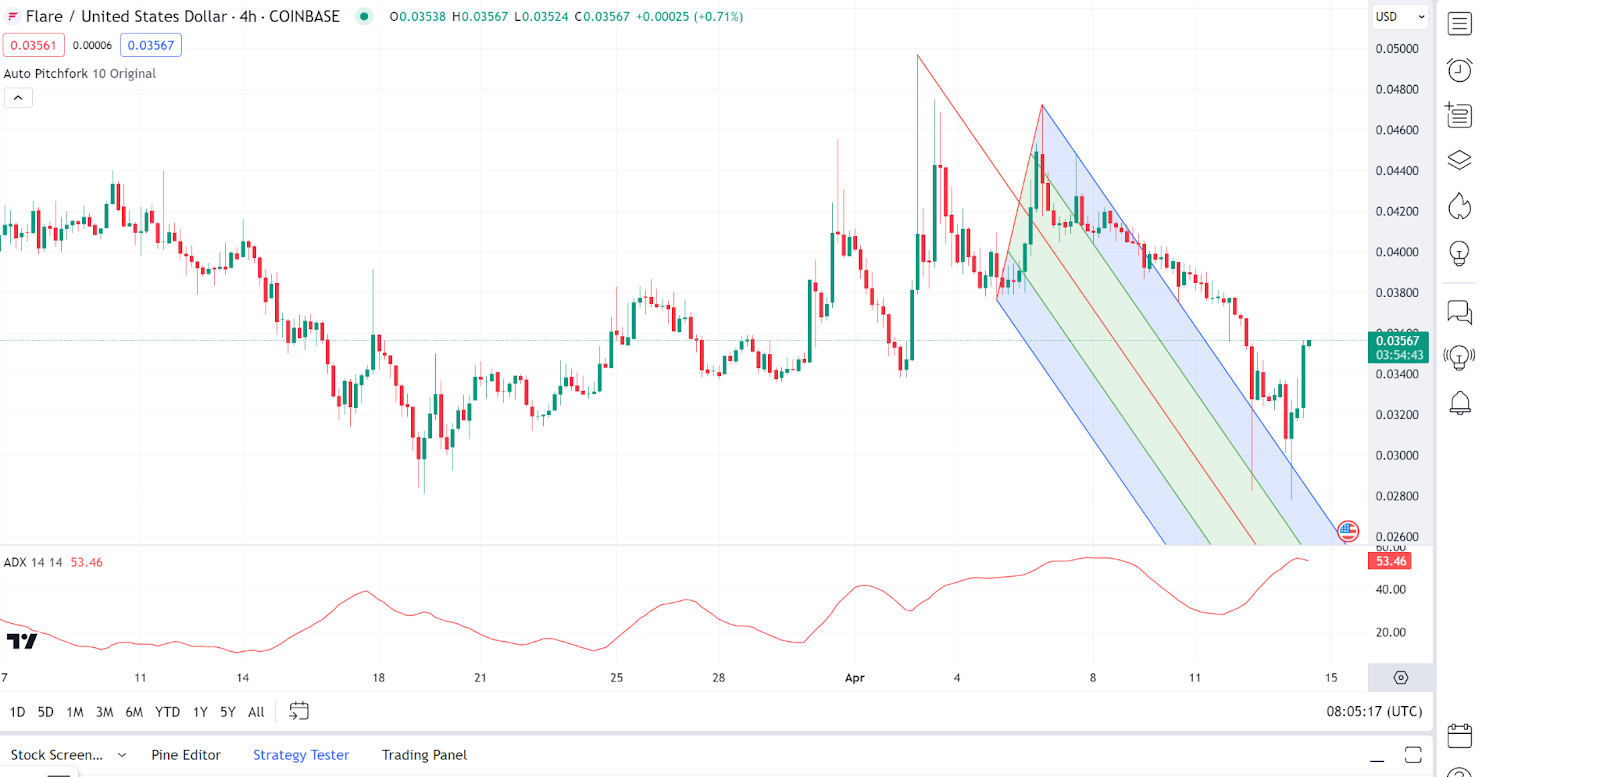
Flare ($FLR) was another gainer in today’s session, as it posted some remarkable sessions. The Flare chart shows a downward channel, with the price currently at the upper boundary, suggesting a potential rejection and continuation of the downtrend.
On the other hand, the ADX indicator is above 25, confirming a solid trend, though it seems to be declining slightly, indicating that the trend strength may decrease. As of press time, the Flare price stood at $0.03507, representing an 8.2% pump from its previous 24-hour price.
Ondo Price Review
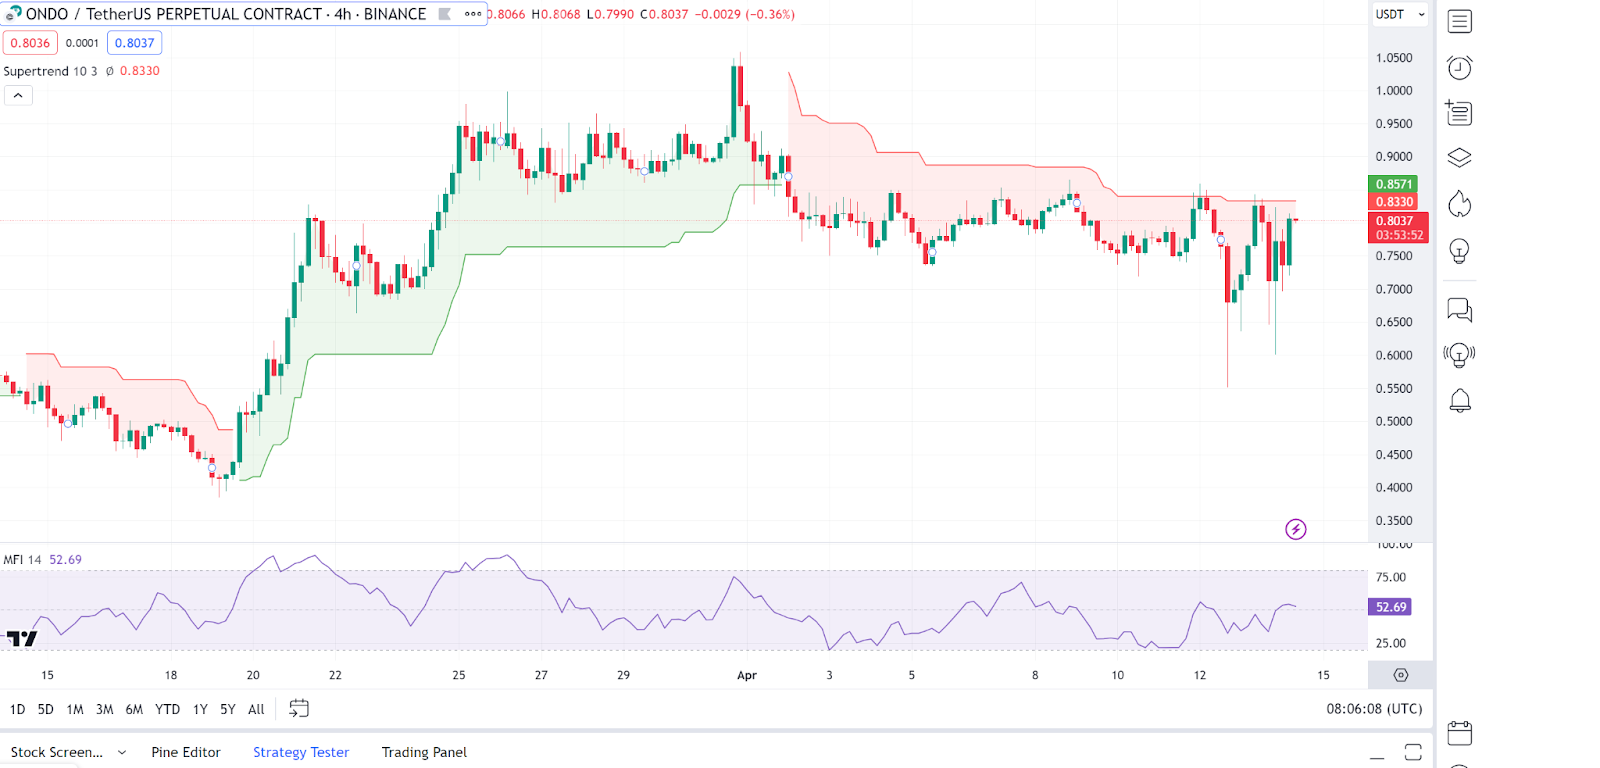
Ondo ($ONDO) is another gainer in today’s session. The $ONDO chart demonstrates a sideways trend within the Ichimoku Cloud, which indicates a lack of clear trends and suggests consolidation. The price is hovering below the cloud, which may act as resistance.
Conversely, the Money Flow Index (MFI) is neutral, not indicating overbought or oversold conditions. As of press time, the Ondo price stood at $0.817, representing a 4.2% pump from its previous 24-hour price.