Shiba Inu is about to retest the critical support at $0.000025, looking to leverage it as a launchpad for a push toward a 30-month high at $0.000056.
The cryptocurrency market is still within a bearish phase, and Shiba Inu has been one of the victims of the onslaught. SHIB has recorded a massive 41% collapse since the correction began, dropping below crucial support levels to trade at the $0.000026 price territory.
SHIB’s Symmetrical Triangle
However, Shiba Inu could be gearing up for a potential recovery, and recent market data confirms this imminent bullishness. Notably, data from the daily chart shows that Shiba Inu has been trading within a symmetrical triangle since the drop from $0.000045 last month.
Since then, SHIB has been pushing to break out of this symmetrical triangle for a marked uptick. Shiba Inu attempted to breach the upper trendline of the symmetrical triangle from March 28 to April 1, but it faced a series of rejections.
This upward push coincided with the broader market slump at the start of the month, with Shiba Inu dropping by nearly 15% from April 1 to 3. This drop led SHIB to retest the $0.000025 low for the first time in two weeks. Despite recovering 5% of its value on April 4, SHIB is still at the mercy of the bears.
Notable analyst SHIB Knight called attention to the current position, stressing that Shiba Inu is presently in an accumulation phase. According to him, he is procuring more tokens at the discounted price to contribute to the imminent price pump.
Shiba Inu Could Push Toward $0.000056
Interestingly, Shiba Inu has now moved to the apex of the symmetrical triangle, with a breakout to either side on the horizon. Amid this condition, the bears have continued to dictate the market, with a possible retest of the $0.000025 territory coming up.
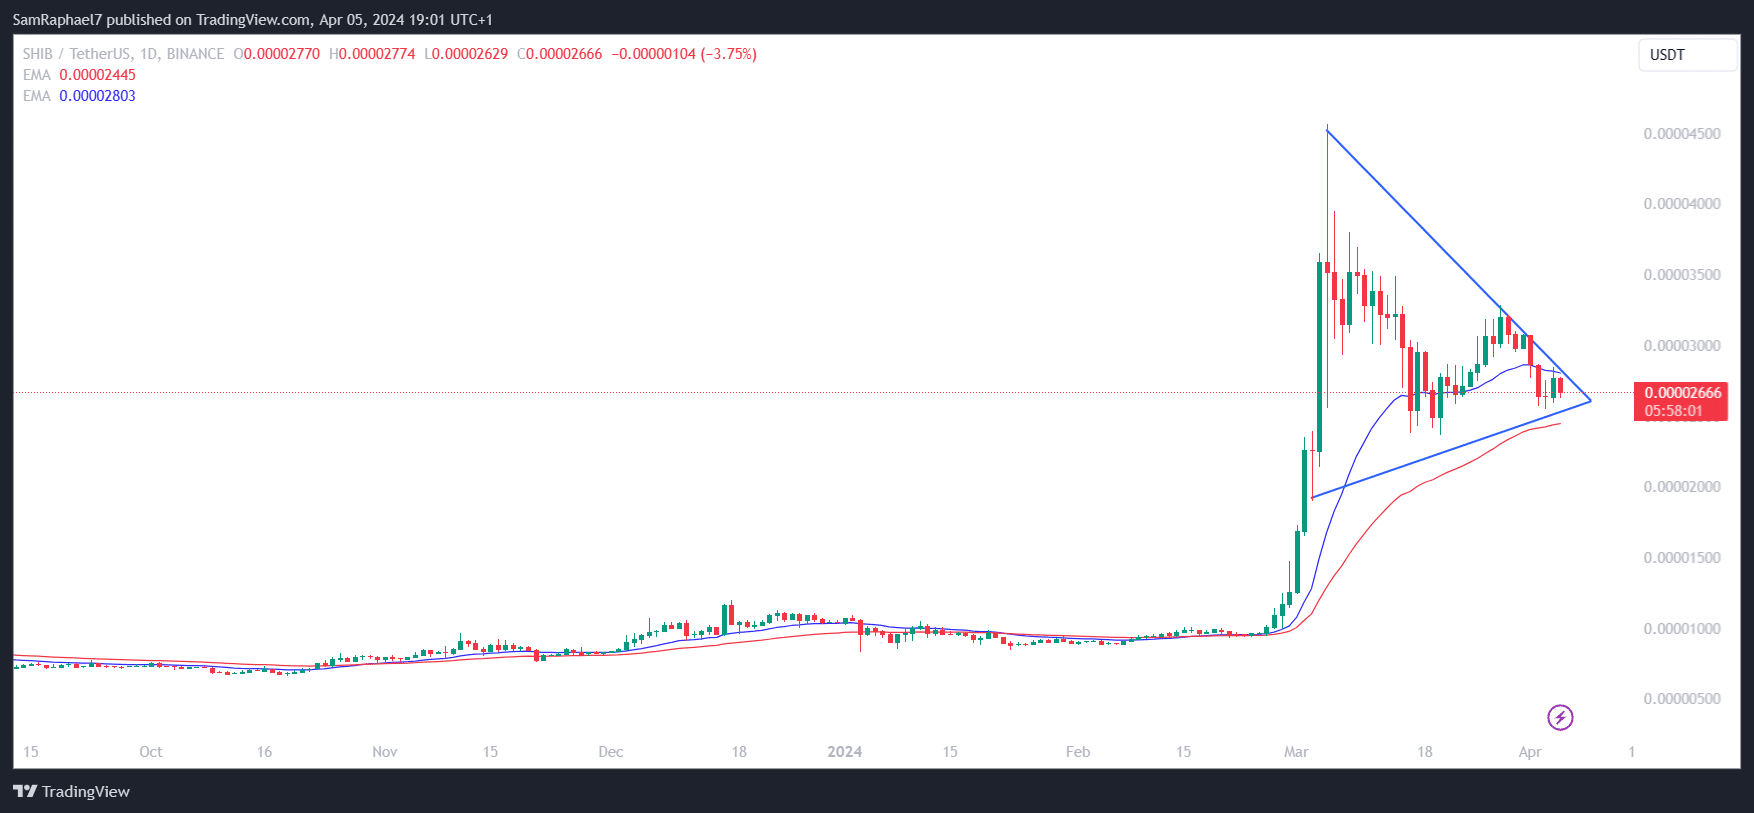
Nonetheless, should SHIB retest this price point at the lower trendline of the symmetrical triangle, it would signal an imminent breakout to the upside. The support at this level is further bolstered by the 50-day EMA at $0.00002446, further preventing any steeper drop.
After retesting this point, SHIB would need to breach the resistance at the 21-day EMA ($0.00002806) to record a push toward greater heights. Following this breach, Shiba Inu would face minimal resistance once it breaks above the $0.000036 level, at which its largest sell wall exists, per data from IntoTheBlock.
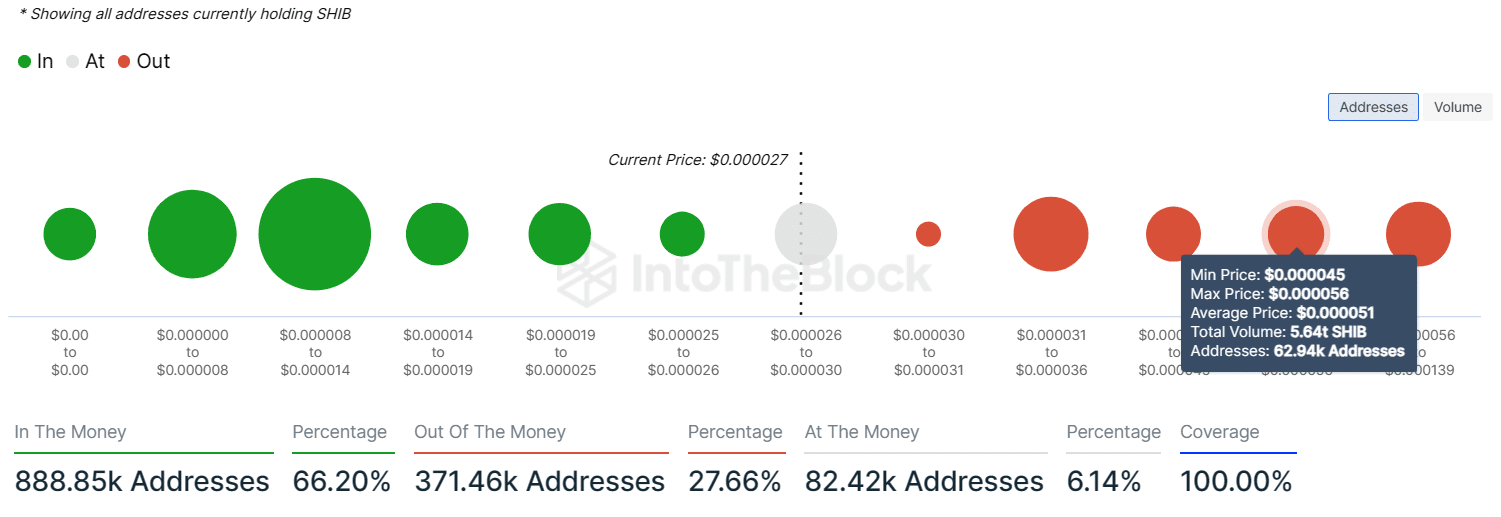
Once the $0.000036 territory gives in, Shiba Inu would face minimal resistance on the path to the $0.000056 zone, where 62,940 addresses purchased 5.64 trillion SHIB at an average price of $0.000051. The last time Shiba Inu saw this price position was in November 2021.
SHIB bulls are already gearing up to bolster this push, with a growing accumulation pattern observed among whales. In addition, Shiba Inu has witnessed a growth in social volume, recently pushing up to an AltRank score of 2, as assessed by LunarCrush. SHIB currently trades for $0.0000266, down 3.75% in the last 24 hours.