The Near Protocol is at a fundamental point in time that could change its price significantly. A close look at $NEAR's price chart shows it is ready for a big test. Right now, $NEAR is trading at about $6.87.
The chart points out that there is a line that $NEAR's price has been following downward. This line is called a
"trendline." If $NEAR's price can go above this line, it could mean the price will start to go up much faster.
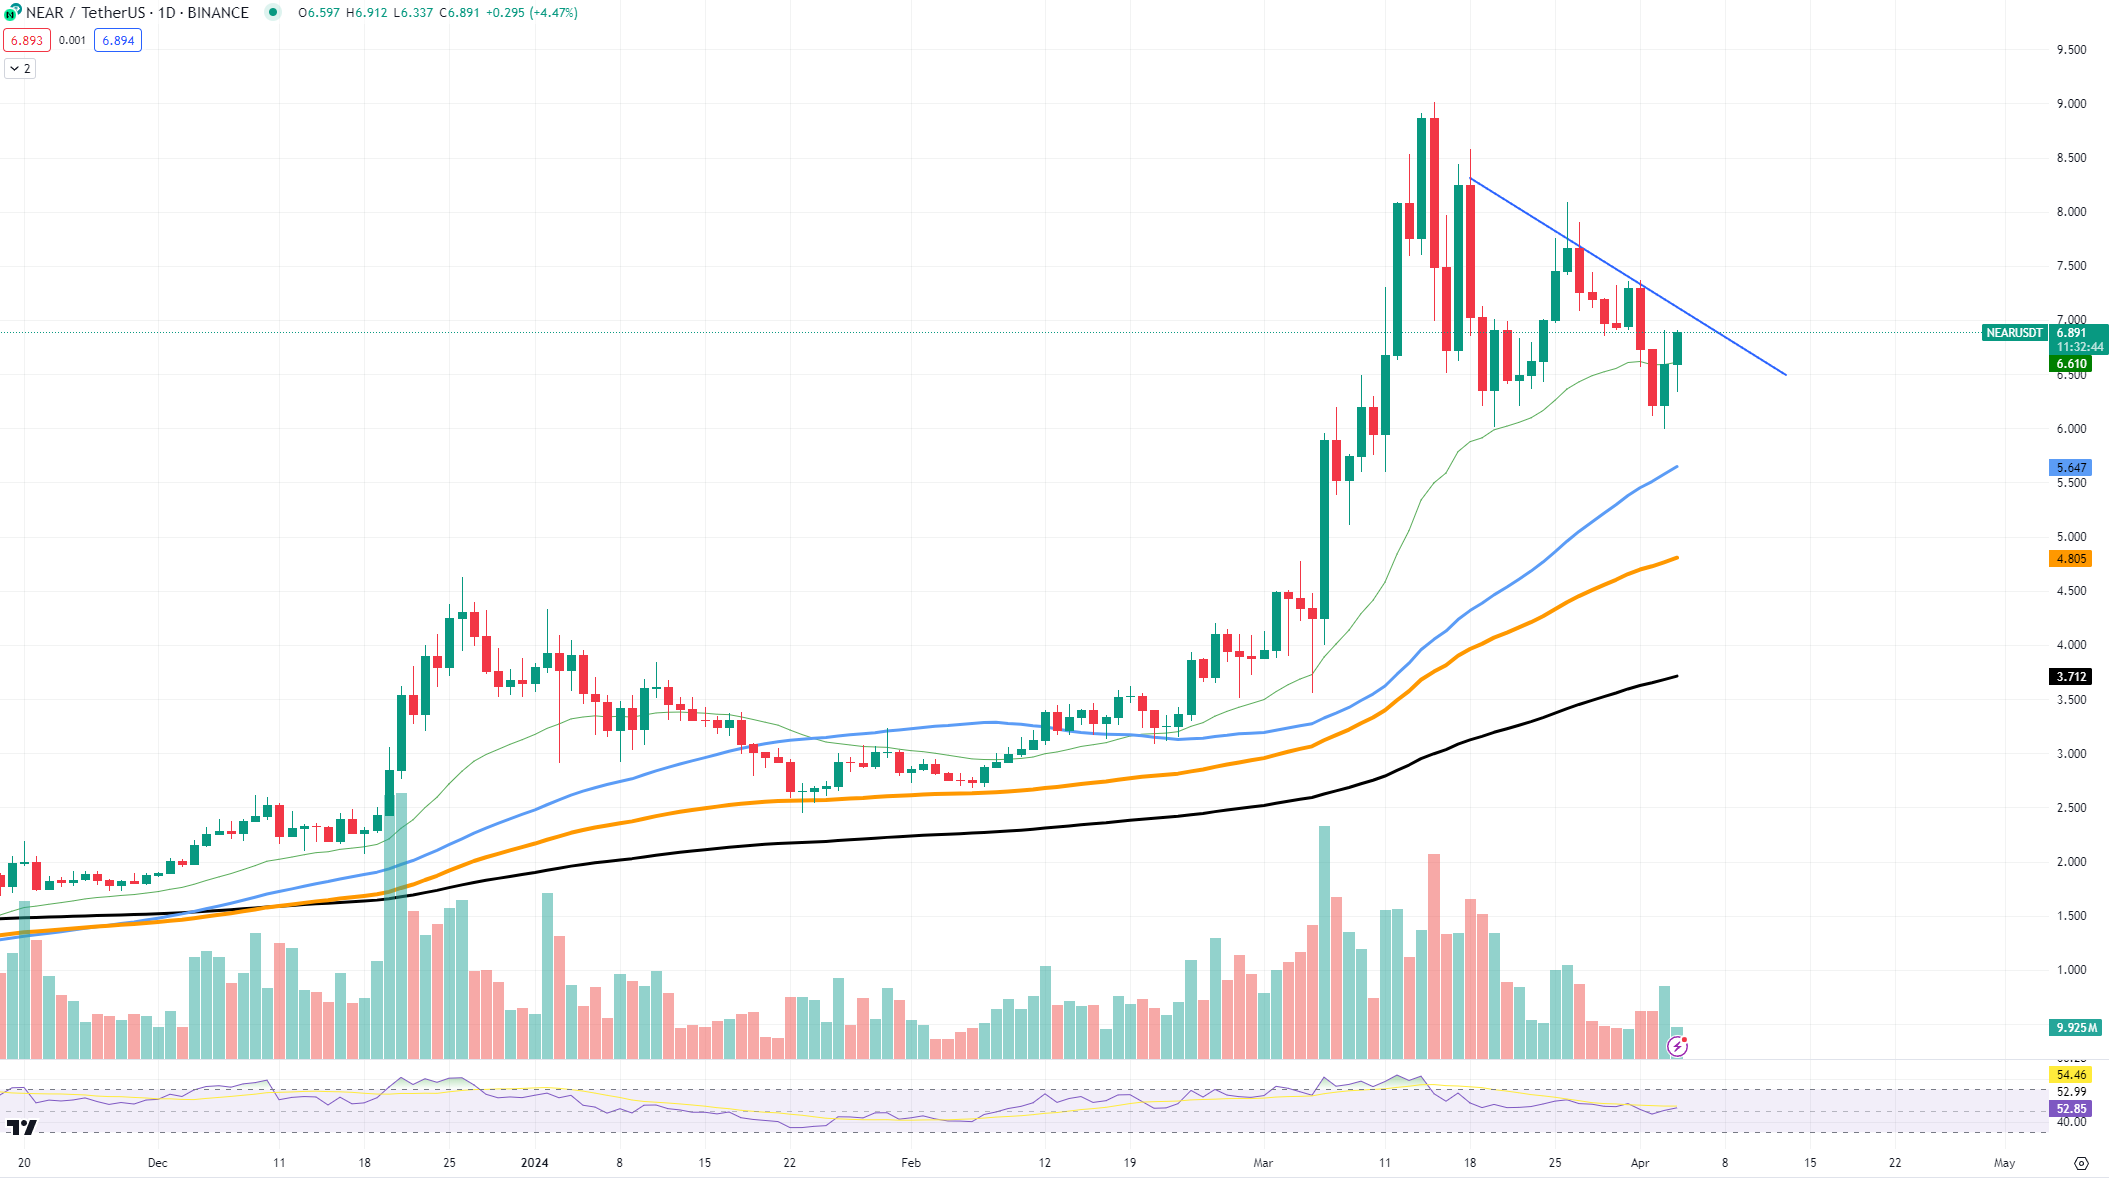
On the chart, there are two main prices we should look at: the "support" level at around $5.64 and the "resistance" level near $7.00. The support level is reflected in the 50 EMA; if $NEAR's price drops to this point, it might bounce back up and slide upwards again. If $NEAR's price can break through this, there is a chance it will continue to climb higher.
For $NEAR to show it can really grow, it needs to break through that trendline and pass the resistance level of $7.00. If it does this successfully, it could signal that $NEAR is starting to rally; that means its price could begin to rise quickly and keep going for a while. However, if $NEAR cannot pass this level, it might stay below the trendline, which could mean its price will not grow as fast.
The future of $NEAR's price depends on whether it can pass these tests. If it does break the trendline and pass the resistance, the next big price to watch would be around $8.07, which is the next level of resistance. On the other hand, if $NEAR's price goes down, it could find support at $5.64, where it may stop falling and stabilize.