Chainlink (LINK) price might encounter obstacles as key indicators point towards potential corrections on the horizon. After a period of relative stability, LINK’s daily active addresses have started to decline, indicating a possible reduction in interest. Additionally, LINK’s Average Directional Index reaching 30 signals a strong and potentially sustained trend for the week ahead.
Concerns are further amplified by the formation of a death cross in the EMA lines on April 1, suggesting an impending downtrend that could lead to further corrections in the LINK price.
Chainlink Network Activity Declines
Examining Chainlink’s daily active addresses provides essential insights into the cryptocurrency’s market dynamics. Initially, during the first three weeks of March, LINK’s daily active addresses remained stable, fluctuating between 4,700 and 4,900.
However, a shift began on March 20, with a noticeable decline from March 21 to March 25, where the LINK’s daily active addresses fell from 4,407 to 3,826.
Following a short period of stability from March 25 to March 30, the beginning of April saw another decrease, with daily active addresses dropping from 3,856 to 3,627. This ongoing decline in daily active addresses could signal waning interest in Chainlink, potentially leading to adverse effects on its price.
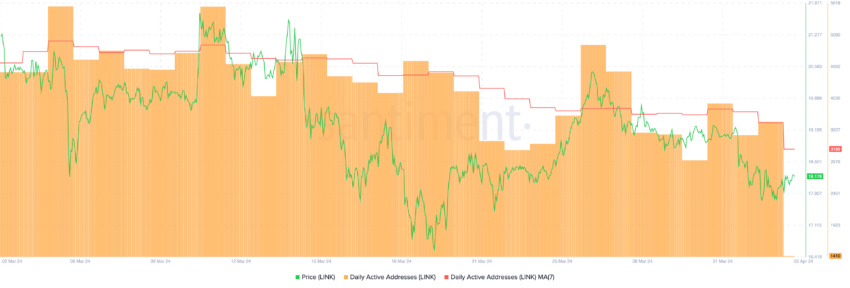
The market could interpret reduced engagement and activity as dwindling confidence in the asset’s value, possibly leading to a price downturn as demand diminishes.
Additionally, the Average Directional Index (ADX) for LINK has recently seen a significant increase, soaring from 9.6 on March 31 to 30.2 by April 2, indicating a crucial shift in market sentiment and momentum. The ADX quantifies the strength of a trend, regardless of direction.
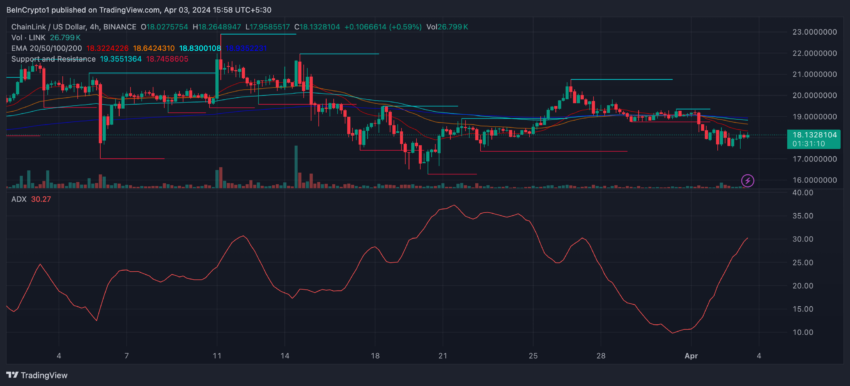
Typically, an ADX reading below 20 suggests a weak or non-trending market, while a value above 25 indicates a strong trend. With Chainlink currently in a downtrend, an ADX of 30.2 suggests a strong downward momentum.
LINK Price Prediction: Back Below $16
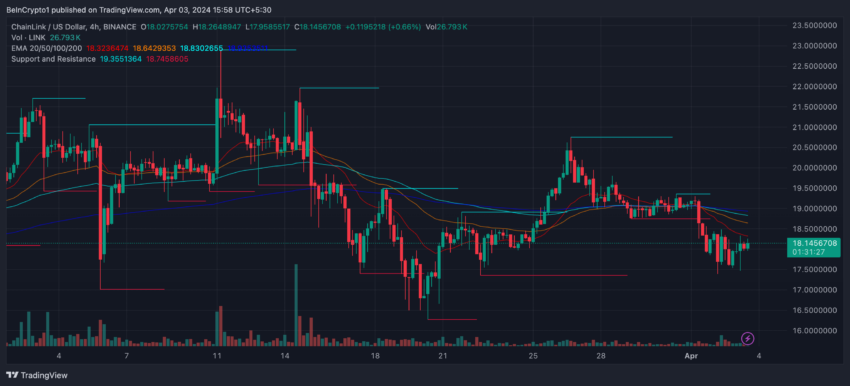
The formation of a death cross on the LINK 4-hour price chart on April 1 points to a potential downtrend.
A death cross occurs when a shorter-term Exponential Moving Average (EMA) falls below a longer-term EMA, often signaling a shift from a bullish to a bearish market trend. EMAs, which emphasize recent price data more than simple moving averages (SMAs), respond quickly to price changes.
In LINK’s situation, the increasing gap between the EMA lines after the death cross indicates a growing bearish momentum. This gap, reflecting a stronger seller presence in the market, could drive prices lower. Should the $17.3 support level fail, the Chainlink price might drop to as low as $16.2.
Read More: Chainlink (LINK) Price Prediction 2024/2025/2030
Conversely, if an uptrend begins, LINK’s price could rebound, overcoming resistance levels to reach $20.7 or even ascend into the $22 zone.