- Bitcoin price retesting $68,500 could mark conclusion of pullback period as BTC halving narrows to under three weeks.
- Ethereum price risks an extended fall as BTC remains in mucky waters.
- Ripple price could drop to $0.5783 before XRP becomes attractive for buyers again.
Bitcoin (BTC) price is coiling up for a definitive directional bias as market eyes remain peeled for BTC halving. As this happens, Ethereum (ETH) price is waiting for the next cue from the pioneer cryptocurrency, while Ripple (XRP) price remains hugely influenced by developments in court.
Whales movements ahead of halving
Ahead of the halving, BTC large holders have joined the retail market in positioning themselves for the halving. Blockchain tracker @whale_alert has flagged multiple whale movements in readiness for this landmark event.
- One whale moved 1,000 BTC tokens worth $68.54 million from Bitfinex exchange to a new unknown wallet.
- A dormant address containing 500 BTC worth around $34.72 million was activated after 11.7 years.
- Another whale moved 1,500 BTC worth $103.08 million from an unknown wallet to another unknown wallet.
Meanwhile, Head of Research at Uphold Inc., @MHiesboeck on X, says, “…institutions and whales have bought more than 12,000 BTC mostly on Coinbase and Kraken and removed them to the private wallets.” The researcher also notes that small investors continue to cash in on every spike, while the wealthy buy every wick.”
During this Monday dump, institutions and whales have bought more than 12,000 $BTC mostly on Coinbase and Kraken and removed them to the private wallets. Small investors keep selling every spike, the big boys buying every wick. That should tell you something.
— Dr Martin Hiesboeck (@MHiesboeck) April 1, 2024
Bitcoin price could bottom out soon
Bitcoin price dropped to sweep the March 27 low of $68,359 on Monday, a liquidity grab that could have set the pace for a move north. If the bulls play their hand right, BTC price could push north. The 100 and 200-day Simple Moving Averages (SMAs) provide support at $67,651 and $67,302. If bulls leverage these as buying opportunities, Bitcoin price could push north.
Increased buying pressure could send Bitcoin price to $73,500, which is the next major resistance before the $73,777 peak. Reclaiming this peak would provide a stronger bullish region between $74,000 and $75,000.
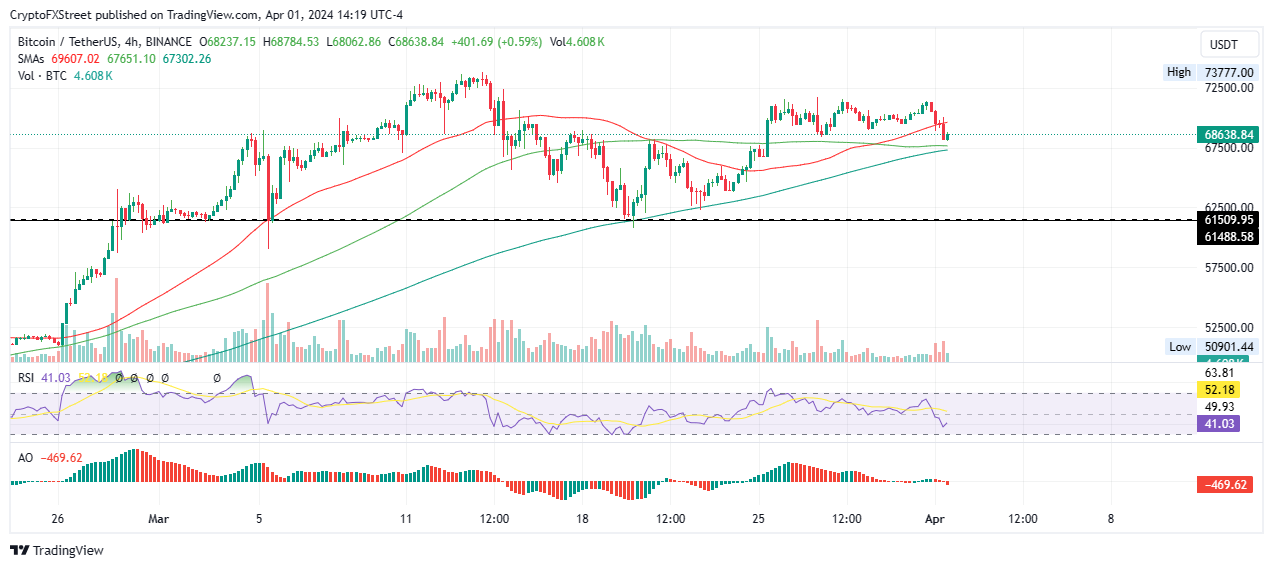
BTC/USDT 4-hour chart
Conversely, if selling pressure extends for Bitcoin price to slip below $68,500, it would be a bearish sign for the short term. This could encourage more selling orders with BTC price likely spiraling to $63,500. This would be another chance for late BTC bulls to jump in before the halving.
Ethereum price could fall if BTC weakness prevails
Ethereum price is trading within the lower range of the market after a rejection from the 50% Fibonacci placeholder. With the Relative Strength Index (RSI) well below 50, and the dwindling Awesome Oscillator (AO) indicator, the market is leaning in favor of the downside.
If bearish sentiment extends in the BTC market, the mawkishness could extend into the ETH market, causing Ethereum price to drop toward the 78.6% Fibonacci retracement level of $3,353. In a dire case, the dump could see ETH test the bottom of the market range at $3,152 before a possible recovery.
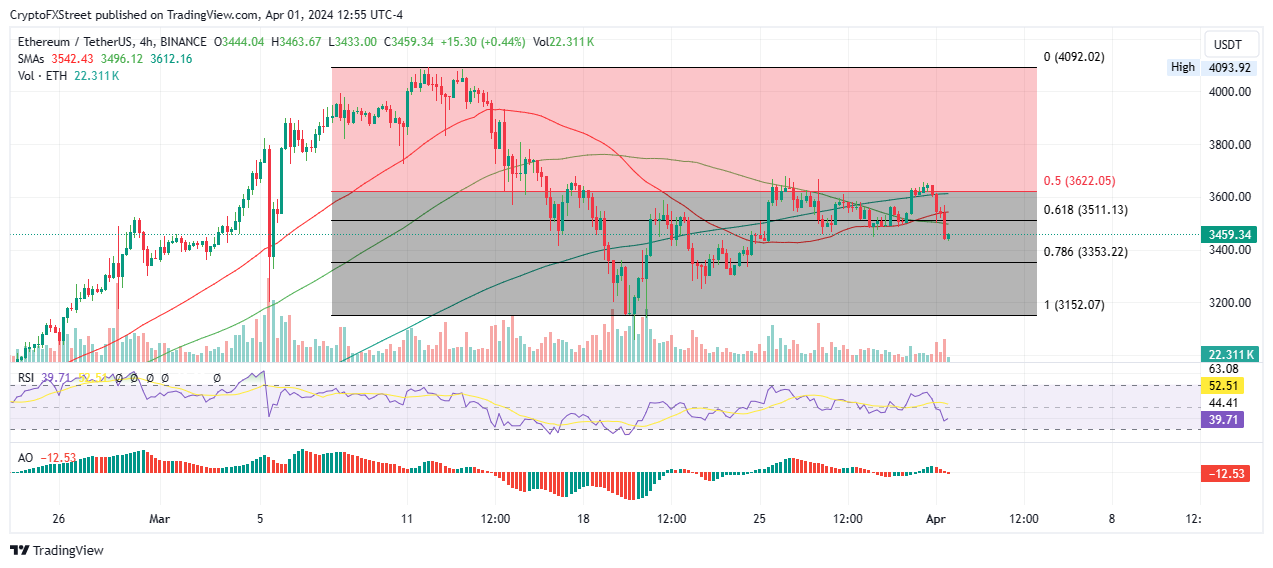
ETH/USDT 4-hour chart
On the other hand, the RSI is ticking north to show growing bullish momentum. If the bulls are able to haul the RSI above 50, the narrative could change, with the ensuing buying pressure catapulting ETH to reclaim lost ground. A break and close above the 50% Fibonacci placeholder of $3,622 would be the first sign.
Ripple price downtrend likely not over
Ripple price is holding above the ascending trendline, but this support could break as XRP bulls fail to show up. With the falling RSI and the AO in negative territory, bearish sentiment is prevailing. If selling pressure increases, XRP price could slip below the trendline to test the $0.5783 support.
This level provides significant support, seeing as it marks the confluence between the 100 and 200-day SMAs at $0.5810 and $0.5791. Failure of this buyer congestion level could see Ripple price fall to $0.5500.
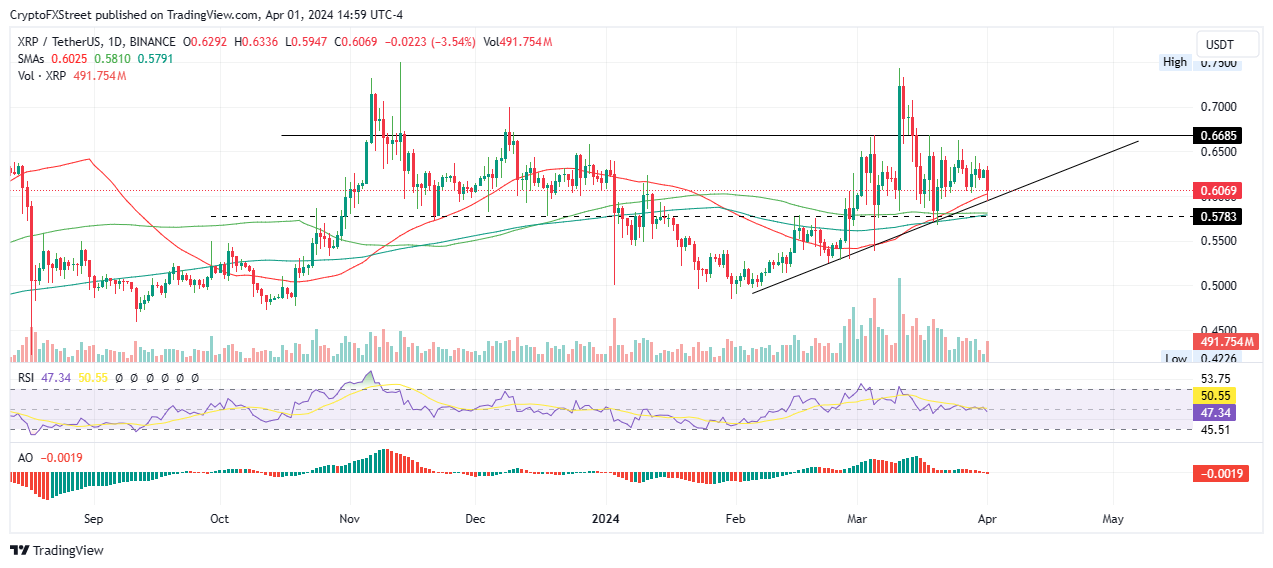
XRP/USDT 1-day chart
On the other hand, increased buying pressure could see Ripple price shatter the $0.6685 roadblock. This would open the path for the altcoin’s market value to extend to $0.7000. In a highly bullish case, the gains could extend to the local top at $0.7500. This would constitute a climb of nearly 25% above current levels.