The BONK price narrative hints at a potential consolidation, as evidenced by a stable number of traders and a declining volume of trades. This observation is further supported by its Relative Strength Index (RSI) currently positioned below the overbought stage, suggesting the market might be settling down following a significant price surge at the onset of March.
Additionally, the almost converging Exponential Moving Averages (EMA) lines indicate a looming bearish trend, which could either precipitate a new correction or, at the very least, lead to a market consolidation.
BONK RSI Is Below the Overbought Stage
The Relative Strength Index (RSI) for BONK, which serves as a crucial gauge to detect whether an asset is in an overbought or oversold condition by analyzing the speed and scale of its recent price changes, has seen a noteworthy decline from 79 to 67 in the past twenty days.
This indicator’s history with BONK reveals that when it reaches an overbought state, it often precedes price hikes; thus, the current drop to an RSI of 67 could indicate an impending period of market consolidation. The Relative Strength Index (RSI) is a widely used momentum oscillator in technical analysis that ranges from 0 to 100, aimed at identifying overbought or oversold conditions of an asset.
Typically, an RSI above 70 indicates that an asset may be overbought and potentially due for a pullback, while a reading below 30 suggests it could be oversold and possibly ready for a rebound.
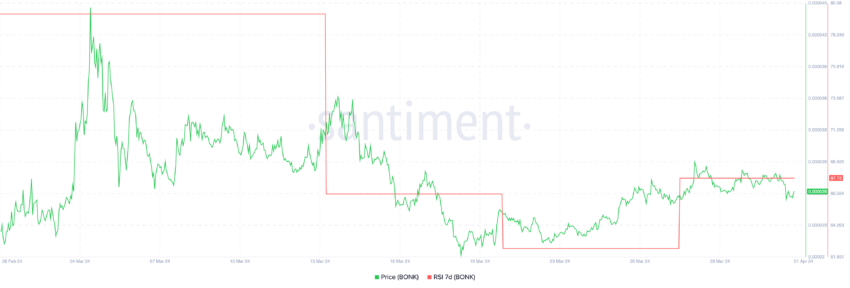
An RSI near 67 often signals stability, avoiding the volatility of being overbought. It suggests BONK is in a ‘goldilocks zone’. It’s not too bullish or bearish. The market appears balanced and stable.
Investors may see this as a sign of upcoming market balance. They think BONK might start consolidating soon. This means its value could be steady after a time of rapid growth or correction.
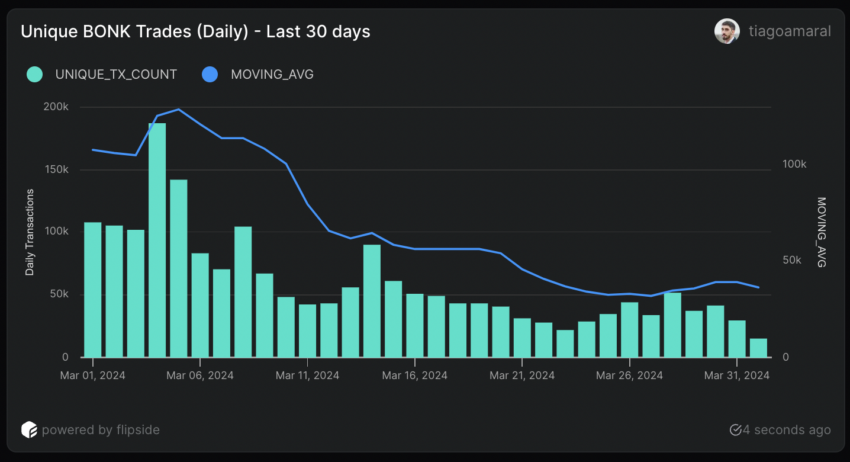
BONK Activity Is Declining
On March 4, BONK reached a record high, with daily trades peaking at 187,000. This high, however, was short-lived. Shortly after, it dropped to a 30-day low with only 22,200 trades by March 23. Also, the 7-day moving average for BONK trades has been declining in the past few days. Trading activity has begun to decline, decreasing from 51,600 on March 28 to 29,300 by March 31.
In a similar fashion, the level of daily trader engagement has closely followed this trend. After reaching a peak with 23,200 unique traders coinciding with the peak trading volume on the same day, there was a significant downturn, ushering in a period of market stabilization around the middle of March.
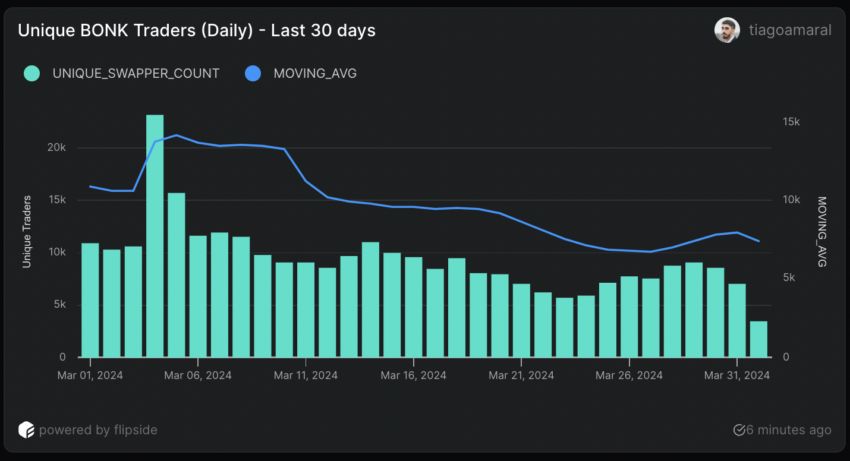
This phase of relative calm, however, was just the precursor to a noticeable downtrend in trader activity in the latter days of the month, with the number of active traders falling from 9,030 on March 29 to just 7,050 by March 31.
Both 7-day moving averages started to drop on the last day noted. This suggests investors might be shifting their focus from BONK to other new memecoins. These coins might promise higher returns.
BONK Price Prediction: Is The Party Over?
Recently, one of BONK’s short-term Exponential Moving Average (EMA) lines converged towards a long-term EMA line, suggesting a move toward market consolidation.
This condition, often interpreted as a period of stabilization after significant price movements, is crucial for confirming the asset’s current price level as sustainable before any further directional trend develops.
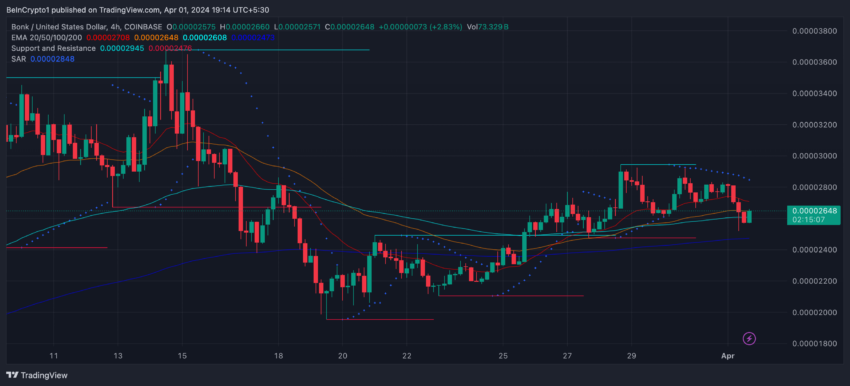
EMA lines prioritize recent price data. This allows them to offer quick insights into potential market changes. For BONK, the EMA lines moving closer together signal a balanced investor sentiment. It shows a phase without clear bullish or bearish momentum. This suggests a likely price equilibrium.
At present, BONK is encountering a pivotal support level at $0.000024 and $0.000021. Holding above this level might stabilize its price, preventing significant declines.
However, should BONK fail to maintain this support, it risks a downturn towards $0.0000195. On the other hand, if an uptrend appears, the BONK price could retest its resistance levels at $0.000035 and $0.000036.