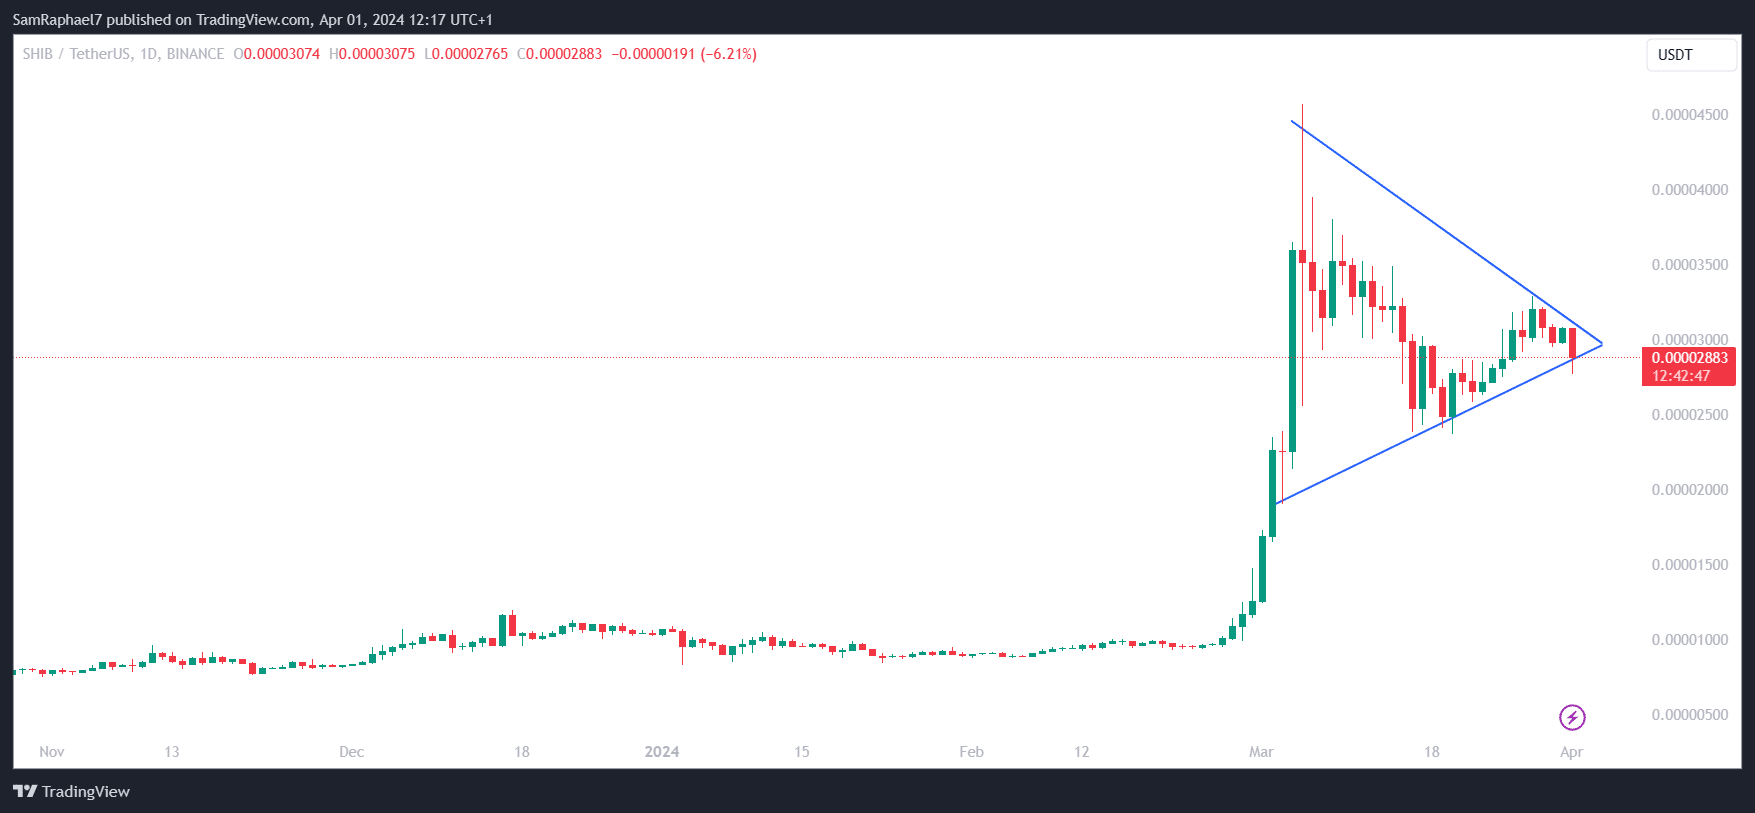
Shiba Inu could be on the verge of another impressive 2x price increase, securing a push toward $0.000058 following a breakout from the multi-week symmetrical triangle.
The cryptocurrency market remains in a consolidation phase, with prices looking to recover from the previous market turmoil. Shiba Inu is also showing bullish signs, preparing to breach pivotal resistance levels in an attempt to reclaim last month’s peak of $0.000045.
Amid the current market condition, prominent market analyst Captain Faibik believes Shiba Inu’s forthcoming recovery campaign could be much more substantial than envisioned. Citing data from a 6-hour chart, he confirmed that SHIB is currently trading within a symmetrical triangle.
$SHIB #Shiba another 2x Bullish Rally incoming ✍️ pic.twitter.com/srIRdxAfPm
— Captain Faibik (@CryptoFaibik) March 31, 2024
For context, A symmetrical triangle forms when an asset sees converging trendlines that connect a series of lower highs and higher lows. It shows a period of consolidation where the price fluctuates within narrowing levels, indicating indecision in the market.
Since collapsing from the $0.000045 high on March 5, Shiba Inu has traded within this triangle, with attempts to break in either direction facing opposition. The bulls leveraged $0.00002366 as formidable support to hedge against any drops below the lower trendline on March 20.
Conversely, when Shiba Inu attempted to break above the upper trendline by soaring past the $0.000034 level on March 28, the bears mounted stern resistance, causing the asset to drop from the $0.00003285 high. Captain Faibik expects SHIB to continue consolidating within the triangle for a few more days.
Shiba Inu Could Clinch $0.000058
However, following this consolidation, the analyst sees Shiba Inu breaking above the upper trendline. According to his chart, the asset’s trajectory could see it surge toward reclaiming the $0.000044 territory before an eventual correction that would result in a drop toward $0.000034.
Nonetheless, Faibik draws out a recovery path capable of pushing SHIB to a high of $0.000058. This would mark a 90.7% increase from Shiba Inu’s price at $0.00003041 at the time of the analysis. For context, the last time SHIB saw the $0.000058 territory was during the previous bull run in November 2021.
SHIB has retraced some of its recent gains since Faibik’s analysis, collapsing below $0.00003 as it begins April on a bearish note. SHIB is down 6.15% this month, mirroring the dominant trend in the broader market, as Bitcoin (BTC) and Ethereum (ETH) record massive losses.
Interestingly, Shiba Inu has also formed a symmetrical triangle on the daily chart. However, the recent downward movement has pushed it to the boundaries of the lower trendline. With the asset currently trading for $0.00002883, the bears are threatening to trigger a break below the lower trendline.

 thecryptobasic.com