With the market heating up, Coin Edition takes a closer look at assets generating widespread interest. Here is a thorough analysis of four cryptocurrencies and how they might perform going forward.
Solana (SOL)
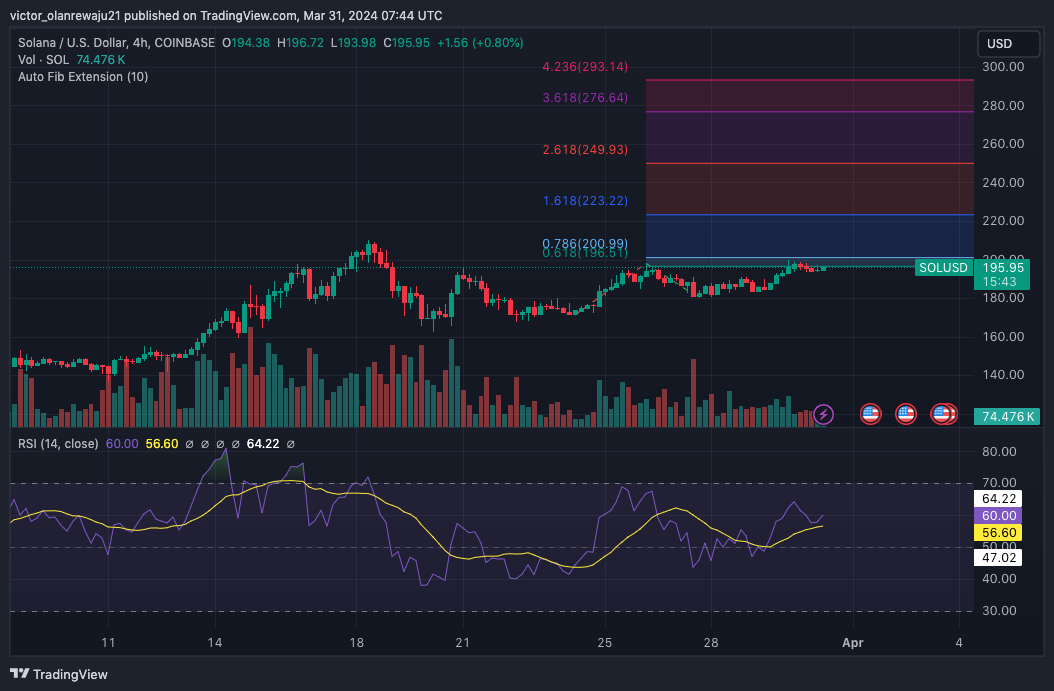
Solana (SOL) broke out of the $190.94 resistance on March 29 after consolidating for some days. However, the Relative Strength Index (RSI) showed that the previous bullish momentum had been halted.
In a case like this, SOL’s price might decline below $195 in the short term. But if buying pressure comes back the value of the token might drive northward. Indications from the 0.618 Fibonacci level suggested that a significant pullback might not occur.
Instead, the price of SOL might climb as other Fib levels indicated. Going forward, bar any market collapse, SOL could increase to $223. If the market is highly bullish, the price might tap $293.
Ripple (XRP)
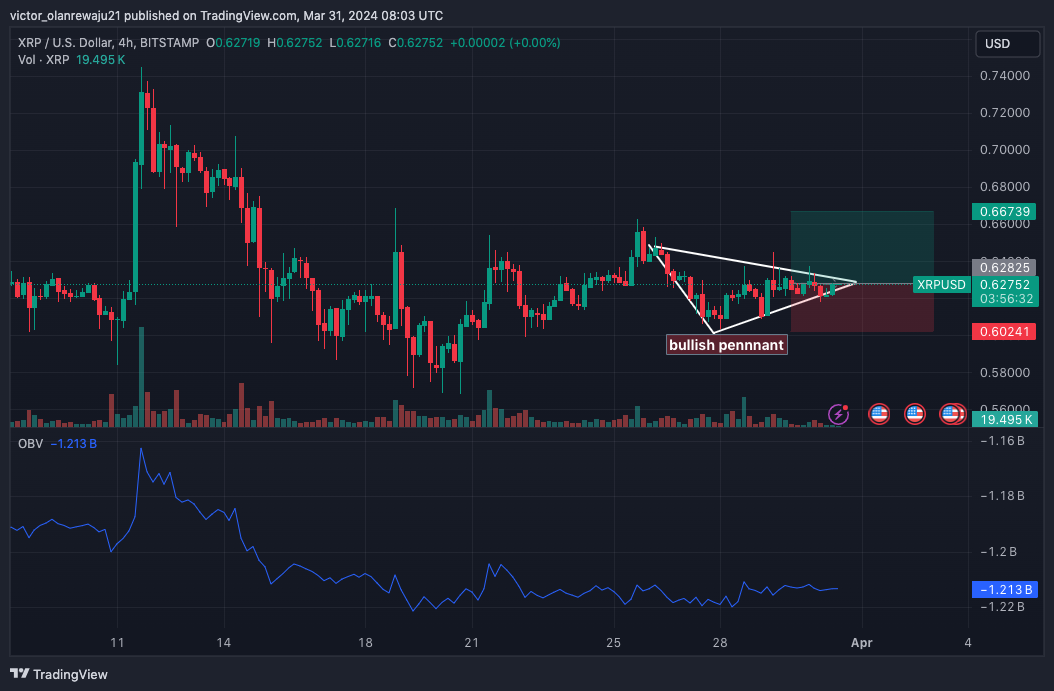
From the 4-hour chart, Ripple (XRP) had formed a bullish pennant pattern, signaling the extension of its recent uptrend. With this pattern in place, the value of XRP might increase by 6.23% while hitting 0.66.
However, traders might need to be watchful. In a case where bears come in to dominate, XRP might defy the forecast and possibly drop to $0.60.
At press time, the On Balance Volume (OBV) remained flat, indicating the dearth of buying or selling pressure. Should this continue, XPR might swing between 0.61 and $0.63 in the short term.
Dogecoin (DOGE)
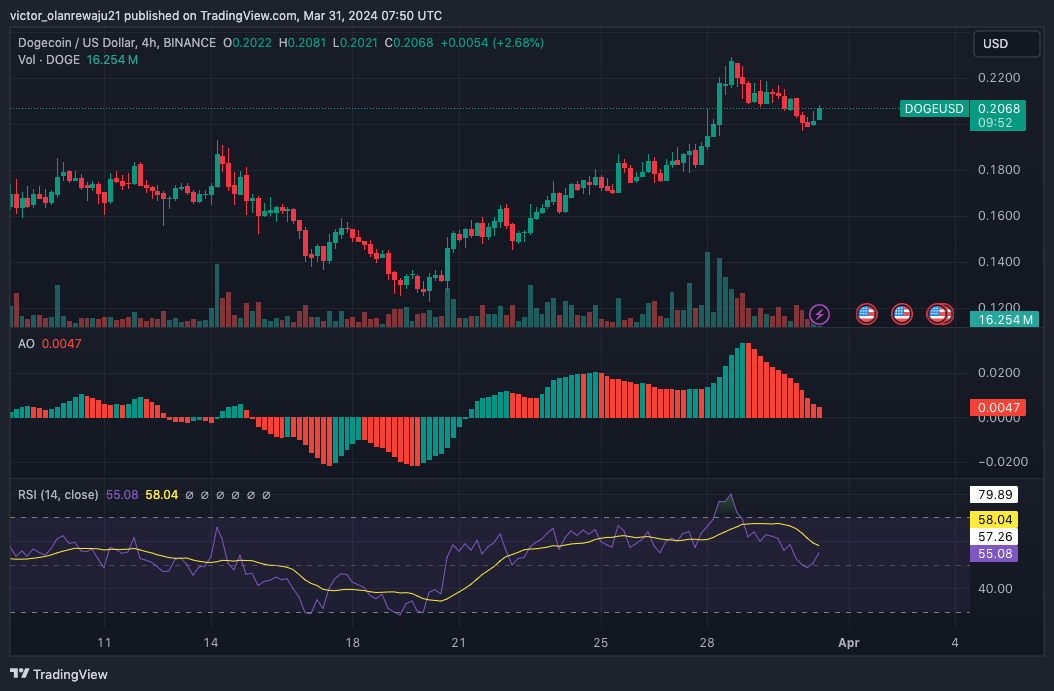
Dogecoin’s (DOGE) performance all month long has been impressive. However, profit booking drew the price back to $0.19 earlier before the meme coin recovered to hit $0.20. Accoridng to the 4-hour DOGE/USD chart, the recent attempt to retest $0.22 might be invalidated.
One of the reasons for this prediction was the Awesome Oscillator (AO). At press time, the AO was postive but with visible red histogram bars. This indicates decreasing upward momentum, which means DOGE might decline to $0.19 again.
However, the RSI showed that buyers were trying to outpace sellers. A successful attempt by buyers might quench the aforementioned decrease. In this instance, DOGE might revisit $0.21. On the other hand, failure could cause bears to drive DOGE as low as $0.16.
1000SATS (SATS)
The trading volume of 1000SATS (SATS) increased by a whopping 247% in the last 24 hours. Likewise, the price jumped by 11.62%, according to CoinMarketCap.
From a technical point of view, the Bollinger Bands (BB) showed that the token might find it hard to extend higher than $0.00057 as it was overbought. As it stands, SATS might drop to $0.00050. However, if the volume continues to increase and the price bounces from $0.00055, SATS might attempt to hit $0.00060.
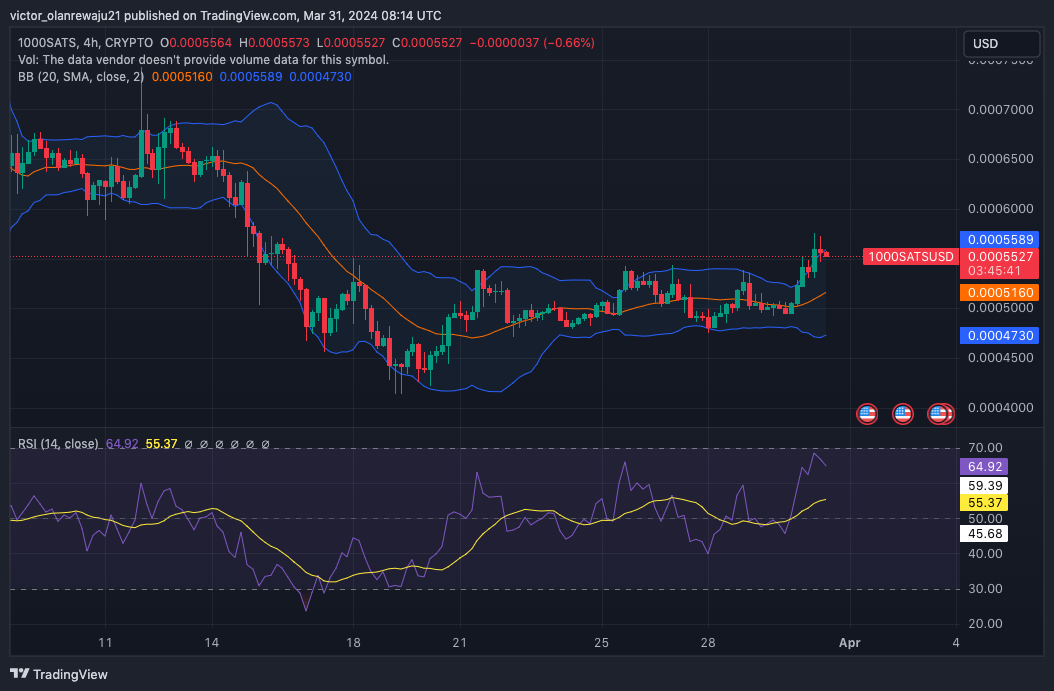
However, the RSI had turned down at press time, suggesting that the token might lose its previous buying momentum. If this is the situation. SATS’ decline to $0.00050 might be validated.
Disclaimer: The information presented in this article is for informational and educational purposes only. The article does not constitute financial advice or advice of any kind. Coin Edition is not responsible for any losses incurred as a result of the utilization of content, products, or services mentioned. Readers are advised to exercise caution before taking any action related to the company.