Dogwifhat (WIF) leads as Solana’s largest memecoin, surpassing PEPE’s market cap. However, it still falls short of DOGE and SHIB. A recent uptick in its value has been noted. At the same time, its 7-day RSI has slightly decreased. This combination suggests a chance for more price growth.
Furthermore, EMA lines are showing a consistent upward trend. This trend hints at a positive future. It implies WIF’s price could soon exceed the $4.7 mark.
Despite Its Growth, WIF Is Still Behind Other Memecoins
WIF has established itself as the leading memecoin in the Solana blockchain ecosystem. It showcases a market capitalization that significantly outshines that of its nearest rival, BONK, by a factor of two.
The memecoin has seen an extraordinary surge of more than 2,000% in the year 2024 alone, skyrocketing from a humble beginning at $0.17 on January 1 to an astonishing $3.75 by March 29. WIF price YTD growth eclipses the growth of other well-known memecoins, such as FLOKI, which has seen a 558% growth, and PEPE, with a 455% increase.
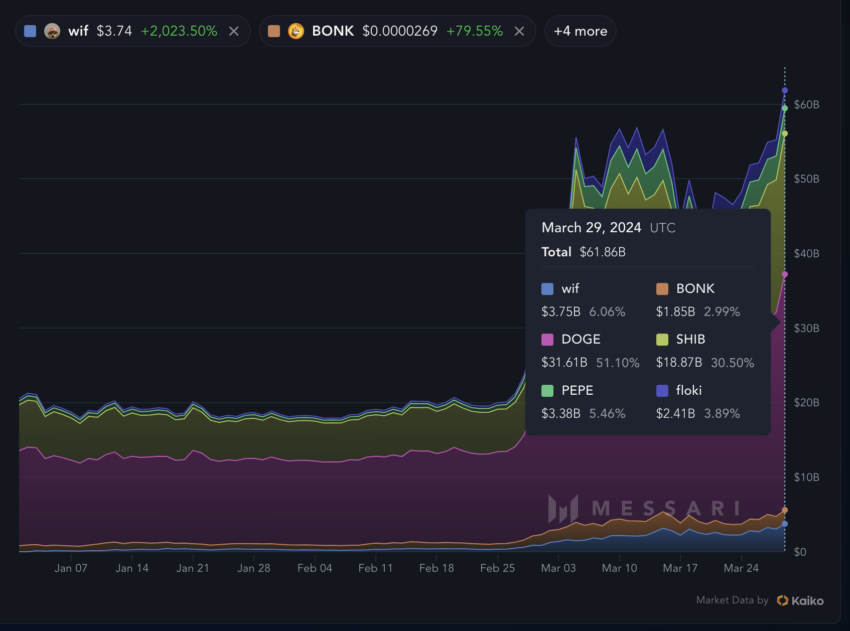
With a staggering 66.22% growth in the last seven days, WIF is now the third-largest memecoin by market capitalization, surpassing PEPE. Despite this monumental achievement, the WIF market cap remains five times smaller than SHIB.
The growing and dynamic Solana memecoin ecosystem suggests WIF’s price could climb even higher.
Despite Its Growth, WIF RSI Still Shows Potential
The price of WIF increased between March 28 and March 29. However, its 7-day Relative Strength Index (RSI) experienced a slight decrease, moving from 86 to 85.
The RSI measures price momentum on a 0 to 100 scale. An RSI above 70 suggests an overbought, potentially overvalued asset likely to pull back. An RSI below 30 indicates an undervalued asset poised for a rebound.
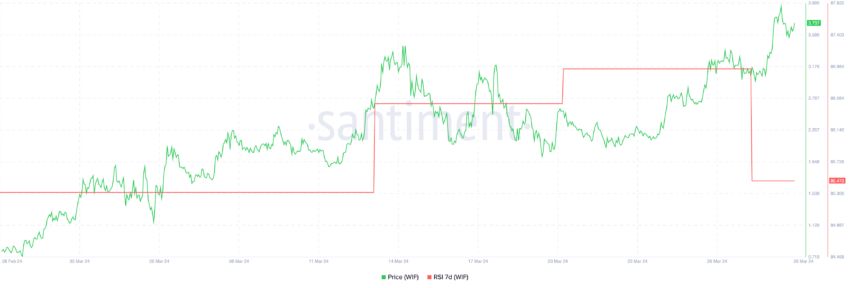
The slight reduction in WIF’s RSI amidst a price increase suggests that while the price is growing, the momentum behind its rise is not excessively overheated, allowing room for further growth without immediate overvaluation concerns.
This is particularly bullish for WIF’s price outlook, especially considering that the last instance of a day-to-day drop in WIF’s 7-day RSI was followed by a remarkable surge of over 100% in its price within the subsequent two weeks, indicating the potential for a repeat performance.
WIF Price Prediction: Can It Cross $4.70 In April?
The analysis of WIF 4-hour price chart reveals an encouraging sign for investors: all Exponential Moving Average (EMA) lines are positioned below the current price line, with short-term lines standing above the long-term lines and a noticeable gap between them.
This configuration is typically considered bullish, indicating strong current momentum and a healthy trend upwards. EMAs are a moving average that places a greater weight and significance on the most recent data points, making them more responsive to new information and price changes than simple moving averages. This sensitivity to recent price movements helps traders identify trend direction more swiftly and accurately.
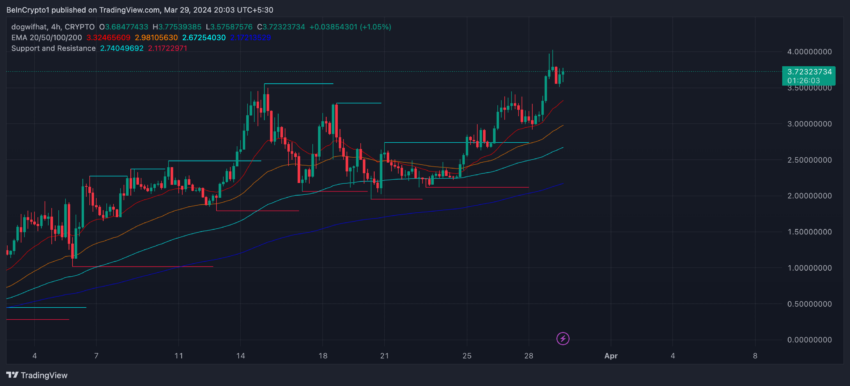
EMA lines positioned with short-term above long-term, all below the price, indicate WIF is on a strong uptrend. This suggests possible continued growth. Considering history, where an RSI drop triggered over a 100% price jump in two weeks, WIF could target $4.70 if trends hold.
Yet, caution is advised. A potential downtrend could see WIF fall to $2.12. This highlights the need to watch market signals and adjust strategies as needed.