The price of Polygon (MATIC) is witnessing a resurgence, indicated by a recovery in daily active addresses following steep declines. This uptick, supported by the RSI 7D, suggests potential for further buying that could boost MATIC’s price.
However, caution is advised as EMA lines point towards ongoing consolidation, hinting at a less bullish outlook for MATIC in the near term. Investors should weigh these contrasting signals carefully.
Polygon Active Addresses Are Growing Again
Polygon (MATIC) experienced a significant milestone on March 14, when the number of daily active addresses soared to 3,301, coinciding with a price surge to $1.27, marking its highest value since February 2023.
This peak reflects a strong correlation between MATIC’s price and its active user base, suggesting that higher engagement levels can drive up MATIC’s price.
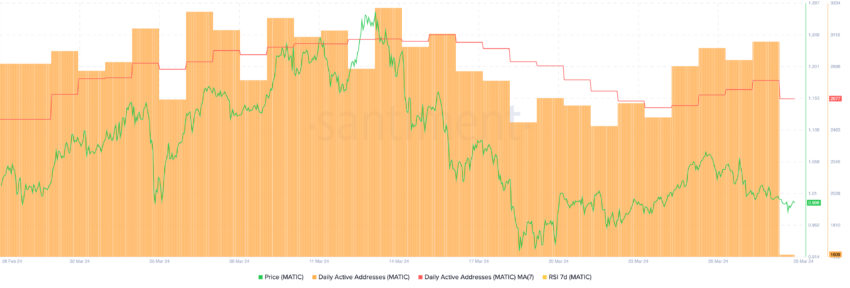
However, a subsequent decline in daily active addresses to 2,550 by March 24 indicated a cooling period. Remarkably, from March 24 to March 28, the daily active addresses rebounded to 3,069, with the Daily Active Addresses 7D Moving Average indicating an uptrend.
This recovery suggests a renewed interest in MATIC, potentially signaling an upcoming price increase. The relationship between active addresses and MATIC’s price is crucial, as rising user engagement often precedes positive price movements, providing a bullish outlook for investors and highlighting the platform’s growing adoption and utility.
Read More: 14 Best Polygon (MATIC) Wallets in 2024
RSI Shows Room For Growth
The Relative Strength Index (RSI) for MATIC has seen a notable shift, currently positioned at 59, a decrease from 66 at its price peak on March 13 and down from 62 just two days ago.
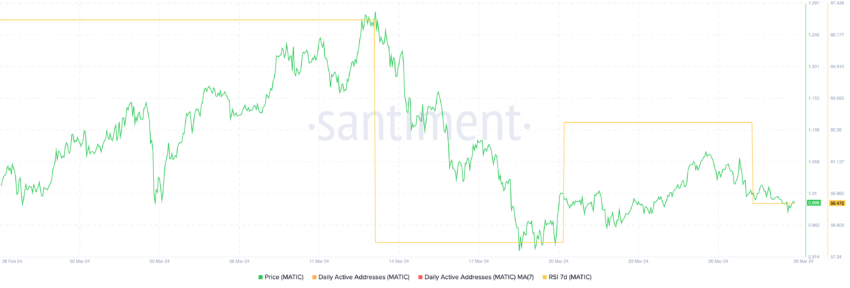
This decline in RSI, is a momentum oscillator that gauges the speed and change of price movements. This might signal a cooling period for MATIC’s previous bullish momentum. RSI values range from 0 to 100, with thresholds set at 70 for overbought conditions, indicating a potential price reversal. It also has a threshold of 30 for oversold conditions, suggesting a possible price increase.
Given that MATIC’s RSI is now at 59, falling from higher values, it likely points towards a period of consolidation. This level suggests that MATIC is neither overbought nor oversold. This indicates that the price might stabilize in the short term as market participants assess its next directional move.
MATIC Price Prediction: EMA Lines Are Not Bullish
Despite the positive indicators from growing daily active addresses and a healthy RSI for MATIC, the EMA (Exponential Moving Average) lines present a less optimistic outlook. EMA lines, which are a moving average that places a greater weight and significance on the most recent data points, are not aligning in a bullish pattern for MATIC price.
Specifically, MATIC’s short-term EMA lines are situated below its long-term lines, and all are above the current price line. This configuration typically indicates a bearish sentiment, suggesting that the price is under pressure and could be expected to decline if current trends continue.
Read More: Top 5 Yield Farms on Polygon
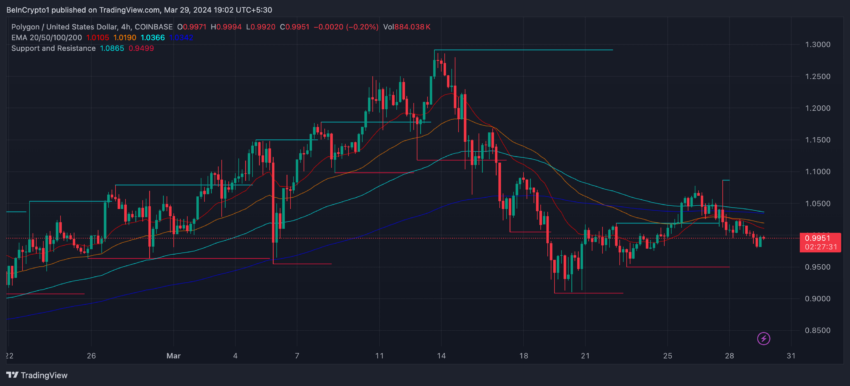
However, MATIC finds robust support at $0.95 and $0.90, hinting at potential consolidation around these levels from its current price. Should the market sentiment shift negatively, a downtrend could drive MATIC’s price down to $0.81.
Conversely, a positive change in market dynamics might propel MATIC towards resistance levels at $1.17 and possibly $1.30 if sustained momentum is achieved.