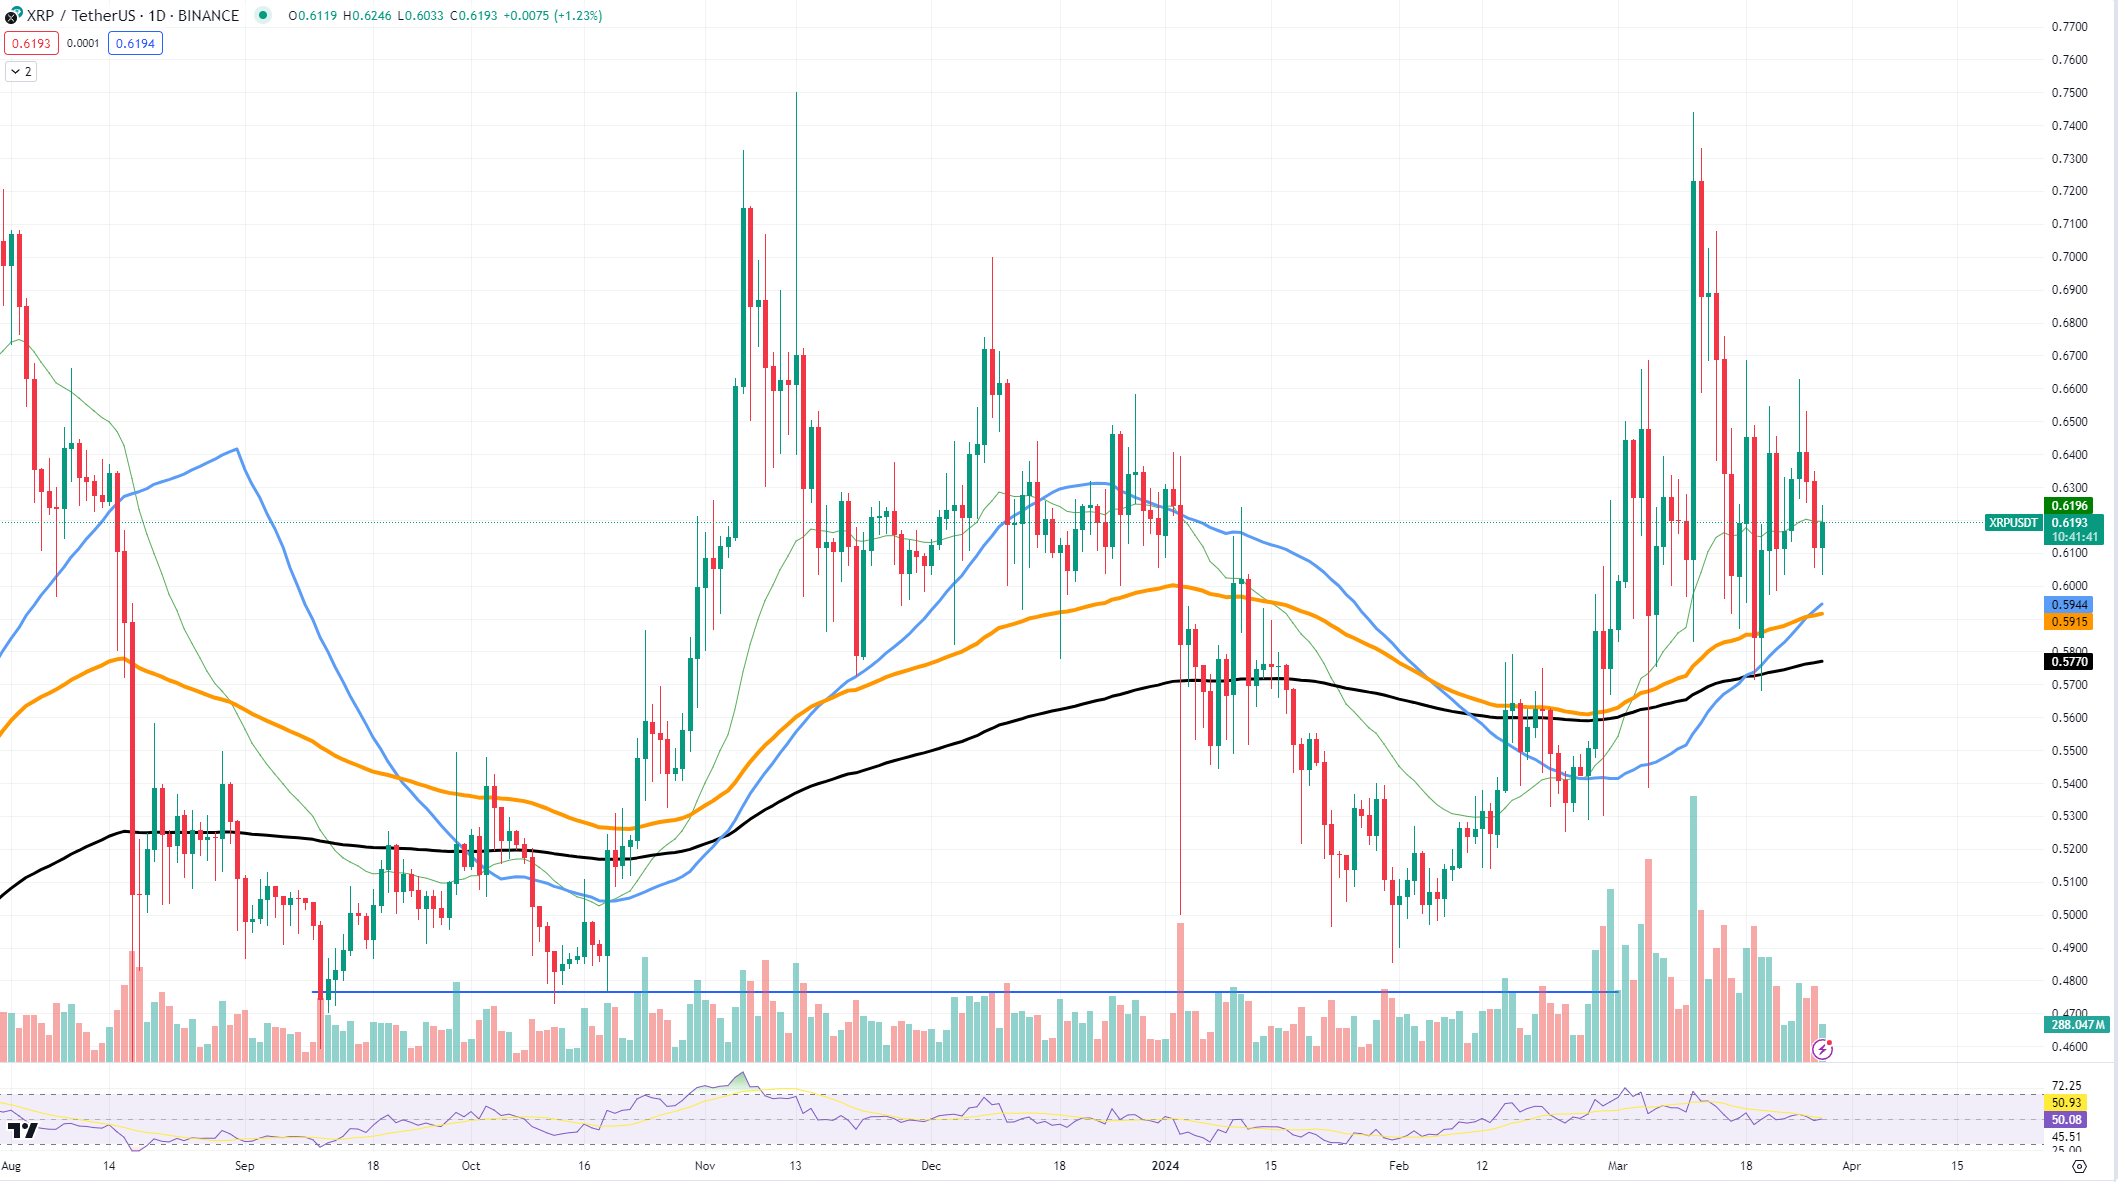
A technical overlook of $XRP's price movement illustrates this struggle, as recent trends signal potential headwinds for this digital asset.
The chart demonstrates that $XRP is navigating a delicate position. The asset has recently veered away from the higher moving average lines, indicating bearish sentiment among traders. These moving averages serve as layered resistance, with the 50-day moving average positioned as immediate resistance, followed by the 100-day and 200-day moving averages as further barriers to price growth.

At the moment, $XRP moves near a significant support level around $0.57, a point at which buying interest has historically emerged. The next critical support lies near the $0.50 threshold, a psychological threshold that acts as support thanks to the "round number" phenomenon. $XRP's move past its moving averages could see resistance levels at $0.63 and the more formidable $0.70 come into play.
Unfortunately, $XRP is not really following market trends and has been showing suppressed dynamics rather than growth similar to what we have seen on Dogecoin.
Dogecoin gains serious strength
$DOGE is seeing an explosive rise in its price, reaching up to $0.2184. Such an explosive price surge is a result of a prolonged reversal, with a flattened-out bottom. The pattern usually emerges on assets that have been trading sideways for a considerable amount of time.
A closer look at the price chart reveals that $DOGE has found strong support at $0.1599, a level that previously saw the asset bounce back after a downward trend. On the upside, resistance can be spotted around the recent high of $0.2184.
If $DOGE can break through this top level, the price might climb even more. However, if the upward push loses strength, the $0.1599 support is key to keeping investors' positive views on the coin.
For the future, if Dogecoin stays above the average lines shown in orange (50-day), blue (100-day) and black (200-day) on the chart, it could mean the upward trend is getting stronger. This would help $DOGE not just as a meme coin, but as a solid option in the larger crypto world.
In terms of the future, growth potential certainly exists. The breakthrough could indicate a strong continuation of the current trend, given increasing demand and positive sentiment among investors. However, Dogecoin's main fuel is community and social media hype, rather than fundamentals and technical strength.
Solana gets squeezed
When you look at $SOL's chart, you can see the symmetrical triangle. It is made by lines that come together and sort of squeeze the price between ascending and descending trendlines. This means that people buying and selling $SOL are evening out, and the price is not changing as much.
Right now, $SOL's price is about $183.74, and it is getting to the pointy end of the triangle. This spot is very important because we expect the price to break out from here.
The price has support at around $167.11, where people have bought $SOL before to make its price go up. If the price of Solana goes below this, it might drop to around $139.84, but this could also be where it stops falling.
The triangle pattern does not tell us if the price will go up or down for sure, so staying cautious as advised. If the price breaks out and goes up, it shows that people really want $SOL and think positively about it.
 u.today
