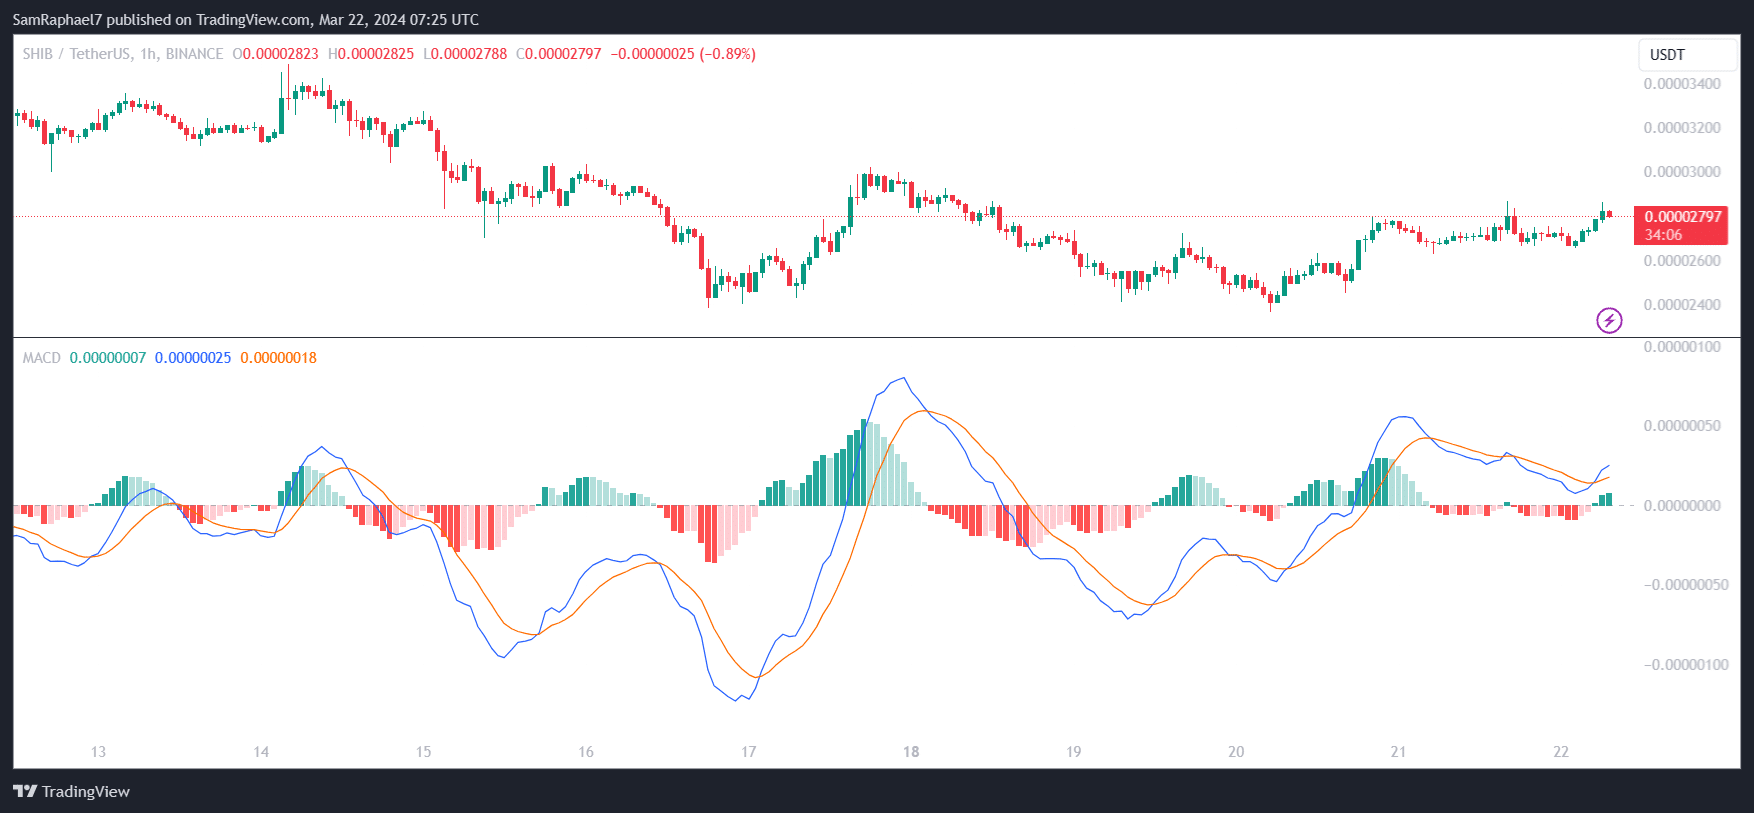
The Shiba Inu (SHIB) MACD Shows strength on the 1-hour timeframe, with the crypto asset looking to breach the $0.00003768 resistance following a recent breakout.
Shiba Inu has fallen into a consolidation phase amid the ongoing market uncertainty. This consolidation comes two weeks after the crypto asset collapsed from the $0.00004567 high on March 5. However, market data suggests SHIB could be regaining its strength.
SHIB’s Downward Trendline
When Shiba Inu dropped from the $0.00004567, it slipped into a downtrend that persisted as the month progressed. The downtrend was further exacerbated by the broader market drop, as SHIB continued to record lower highs each day.
The cryptocurrency’s first attempt to break out of this downward trend came up on March 14, when it spiked to a high of $0.00003487. However, SHIB witnessed opposition from the bears at this level, further slumping 22% in the two days that followed amid Bitcoin’s (BTC) collapse.
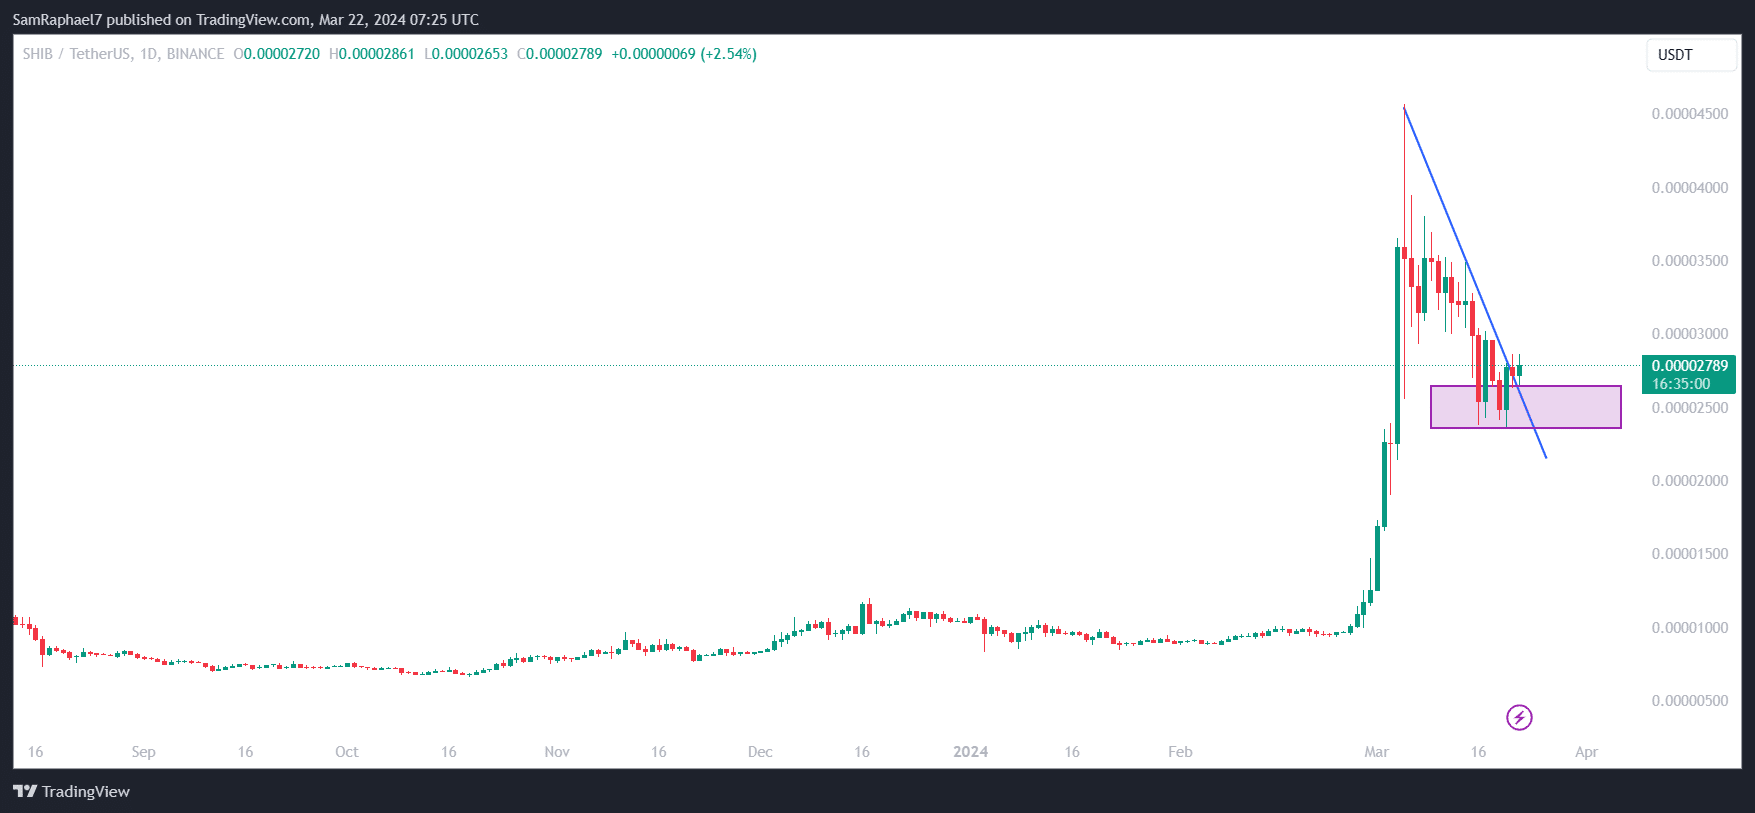
SHIB continued to trade underneath the downtrend until March 20, surging by 11.49% to retest the resistance at the downward trendline. The asset eventually broke out of the downtrend yesterday, but dropped this morning to $0.00002653, as it retested the support at the trendline.
Shiba Inu MACD Shows Strength
With Shiba Inu now trading for $0.00002695, the crypto asset trades at a delicate position. Its next direction from here could represent a push toward new highs or a drop below the $0.00002695 support. Should the latter occur, SHIB could slip into the supply box, with $0.00002366 acting as its next major support.
However, switching to the 1-hour timeframe, Shiba Inu’s market data shows some bullish signals for the short term. For instance, the cryptocurrency’s MACD has moved beyond 0, indicating short-term strength. In addition, the MACD line (blue) is flashing a buy signal, having crossed the signal line (orange).
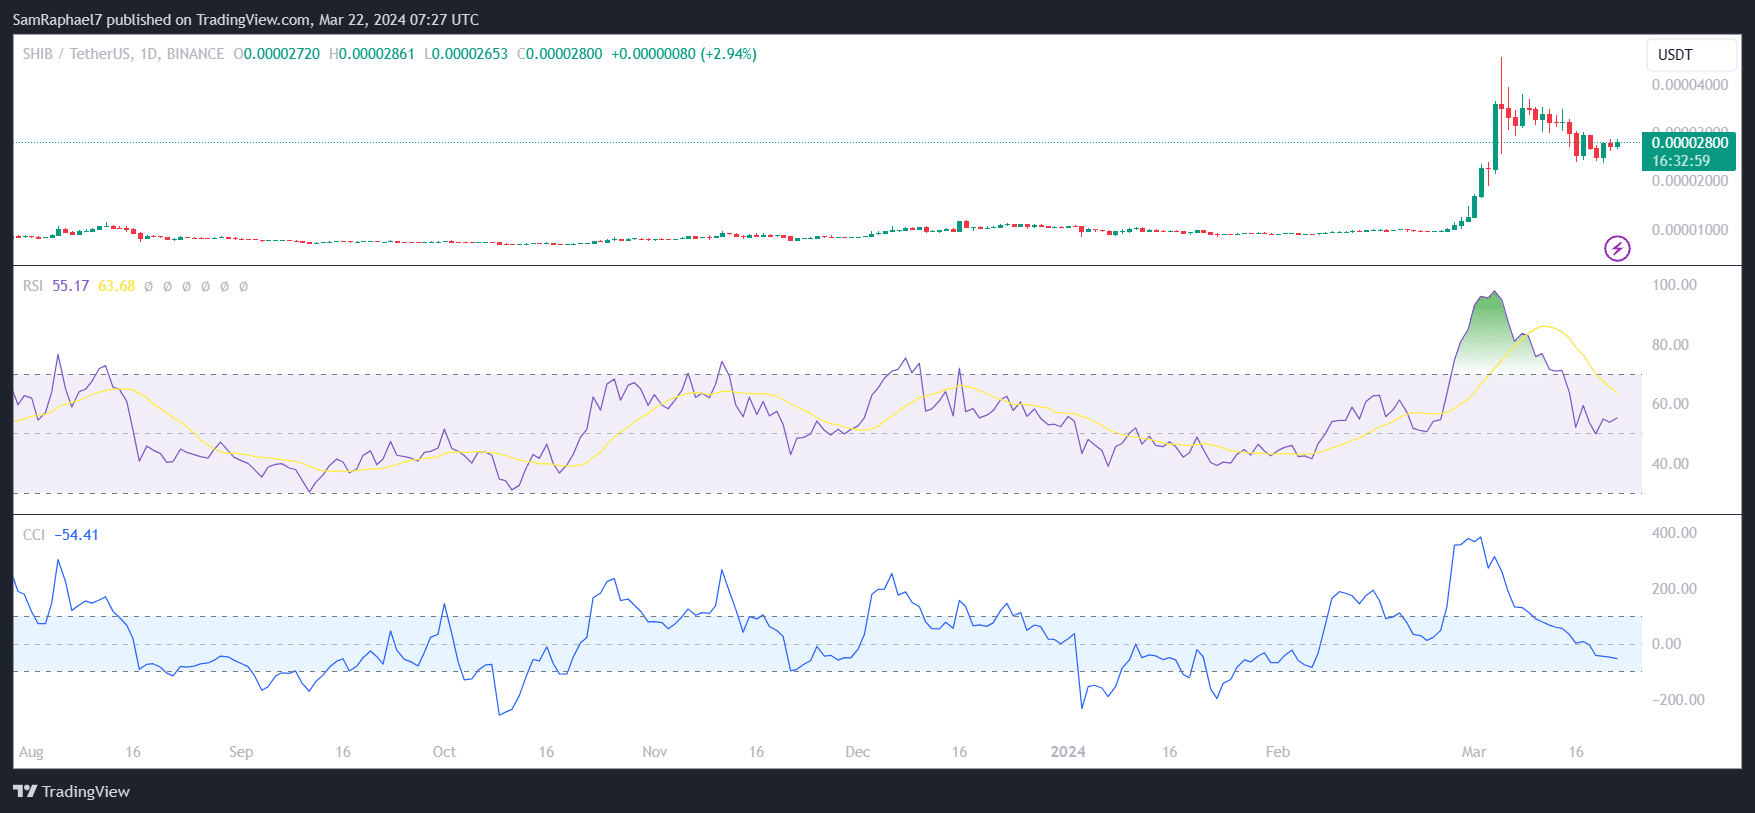
Moreover, for the long term, data confirms that Shiba Inu still has room for growth. Readings from SHIB’s momentum oscillators, the relative strength index (RSI) and the commodity channel index (CCI), reveal that the asset is far from overbought territories.
Remarkably, despite Shiba Inu currently trading at an impressive 23-month high, the token’s daily RSI currently sits at 55.17, suggesting a potential for more upward momentum. In addition, SHIB’s CCI of -54 indicates that it currently trades below the average price.
If SHIB records an upward push from this position, it will meet its first major resistance zone between $0.000030 and $0.00003078. Breaching this level would bring the $0.00003161 resistance into play, with a push above this level potentially leading to the recapture of $0.00003768.