Today’s session is being dominated by bulls as seen from the decreasing global market cap as it dropped drastically. Standing at $2.46T as of press time representing a 4.66% drop in the last 24 hours. The trading volume has, however, risen by 9.3% within the same period to $146.44B.
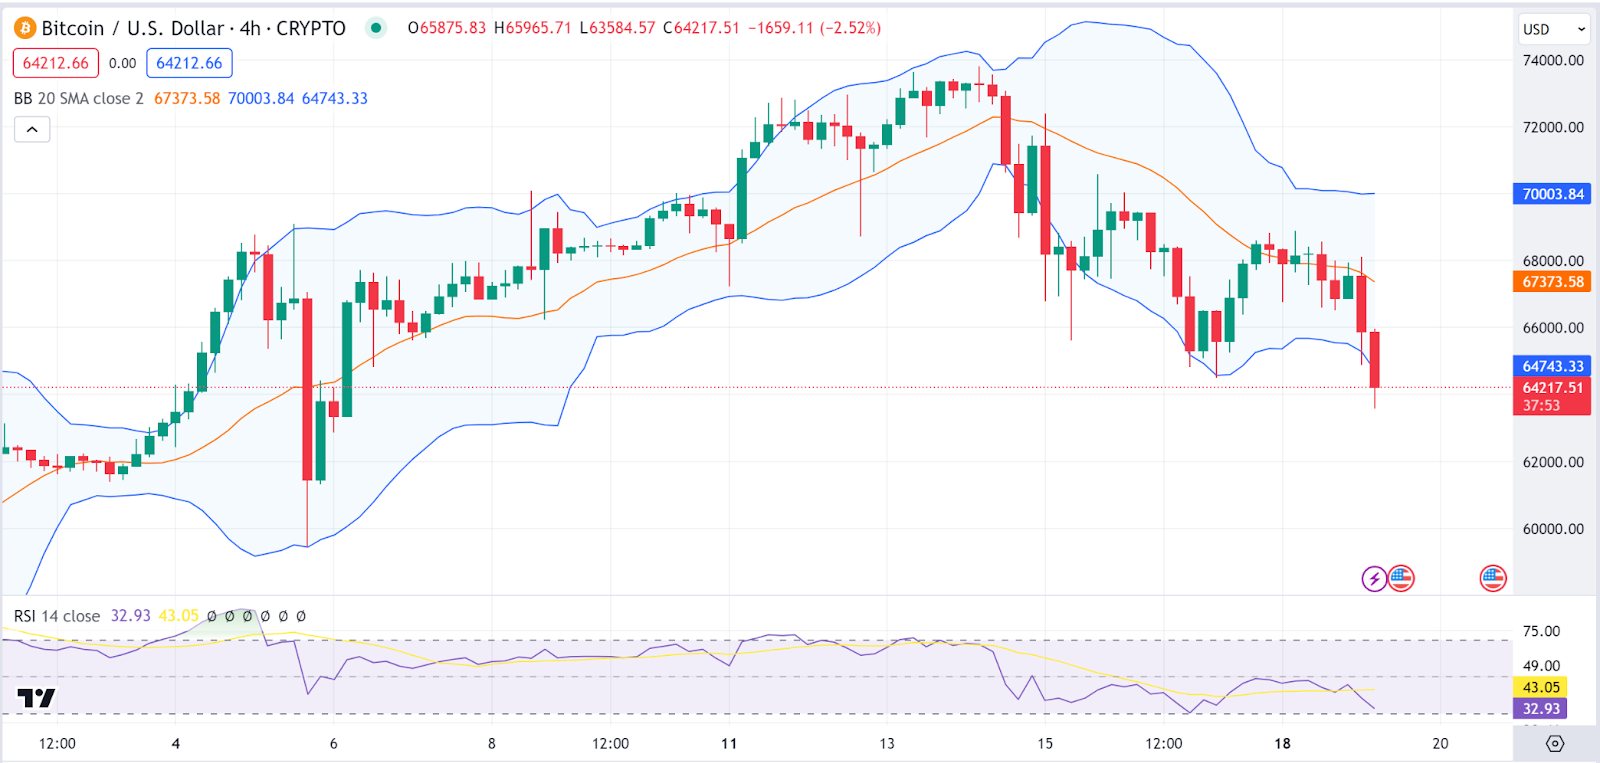
Bitcoin Price Review
Bitcoin (BTC) continues to dip as it drops below the $64.4K. The chart shows a downward trend with the Bitcoin price currently trading below the 20-period Simple Moving Average (SMA) as part of the Bollinger Bands, indicating bearish sentiment.
The upper and lower Bollinger Bands are widening, suggesting increased volatility. The Relative Strength Index (RSI) is around 43, which is neither in the overbought nor in the oversold region but leaning towards the oversold side, indicating possible selling pressure. The has recently broken below a support level, indicating a potential downtrend continuation. The Bitcoin price stood at $64.4K as of press time representing a 5.6% drop over the last 24 hours.
Ethereum Price Review
Ethereum (ETH) is dipping hard as it fails to post gains today. The is also a downtrend, trading below the Supertrend indicator, which signals a bearish market condition. The Moving Average Convergence Divergence (MACD) is below the signal line and trending downwards, reinforcing the bearish momentum.
The shaded area above the Ethereum price action likely represents an Ichimoku cloud, which is red, further confirming bearish sentiment. The Ethereum price stood at $3,348 as of press time representing a 7.67% drop over the last 24 hours.

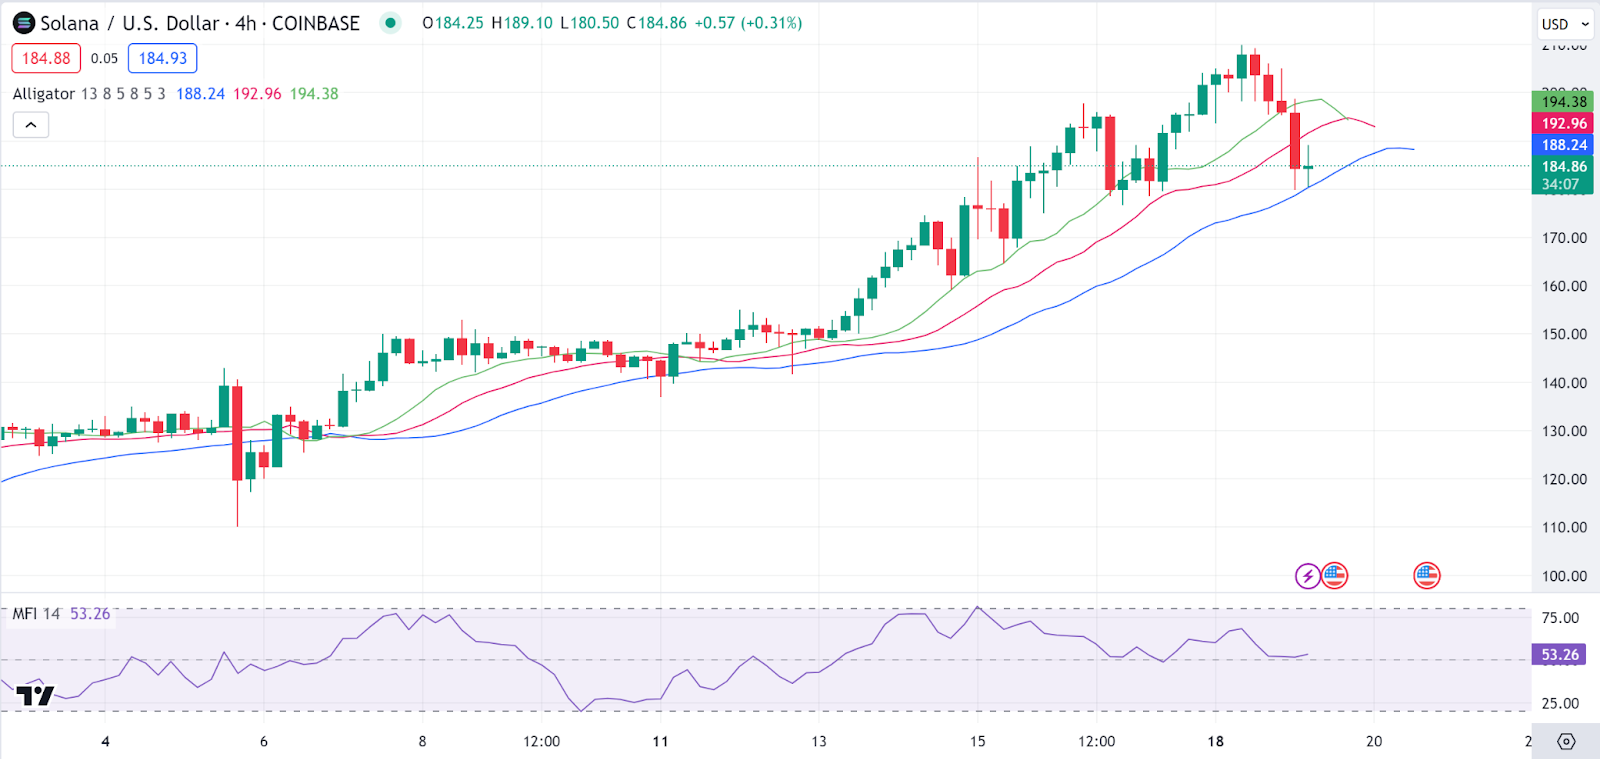
Solana Price Review
Like the other top two crypto tokens, posted a price drop in today’s session. The price action is more mixed. While it’s trading above the Alligator indicator (a collection of moving averages), it has begun to trend downwards as it moves inside the moving averages, indicating bear momentum on the Solana price.
The Money Flow Index (MFI) is around 53, indicating a balance between buying and selling pressure. The Solana price stood at $186 as of press time representing a 7.44% drop over the last 24 hours.
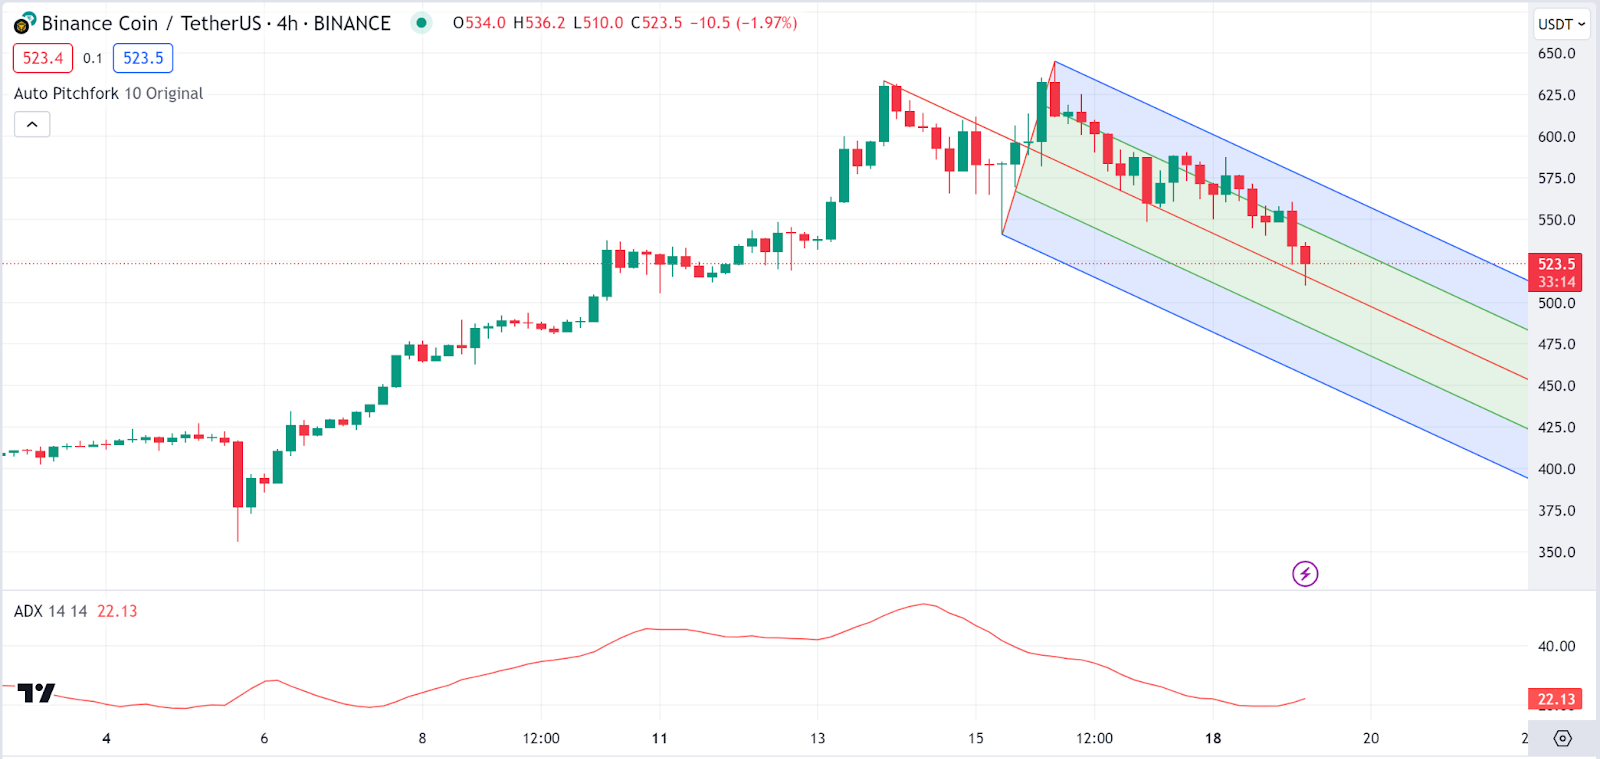
Binance Coin Price Review
Binance Coin has fallen prey to today’s bear market as it posted a notable drop.is depicted inside a bearish channel pattern with the price making lower highs and lower lows, which is a bearish signal.
The BNB price is trading below the Auto Pitchfork median line, which can be seen as resistance in this context. The Average Directional Index (ADX) is around 22, indicating a moderate trend strength; the trend here is downward. The BNB price stood at $524.61 as of press time representing a 9.11% drop over the last 24 hours.
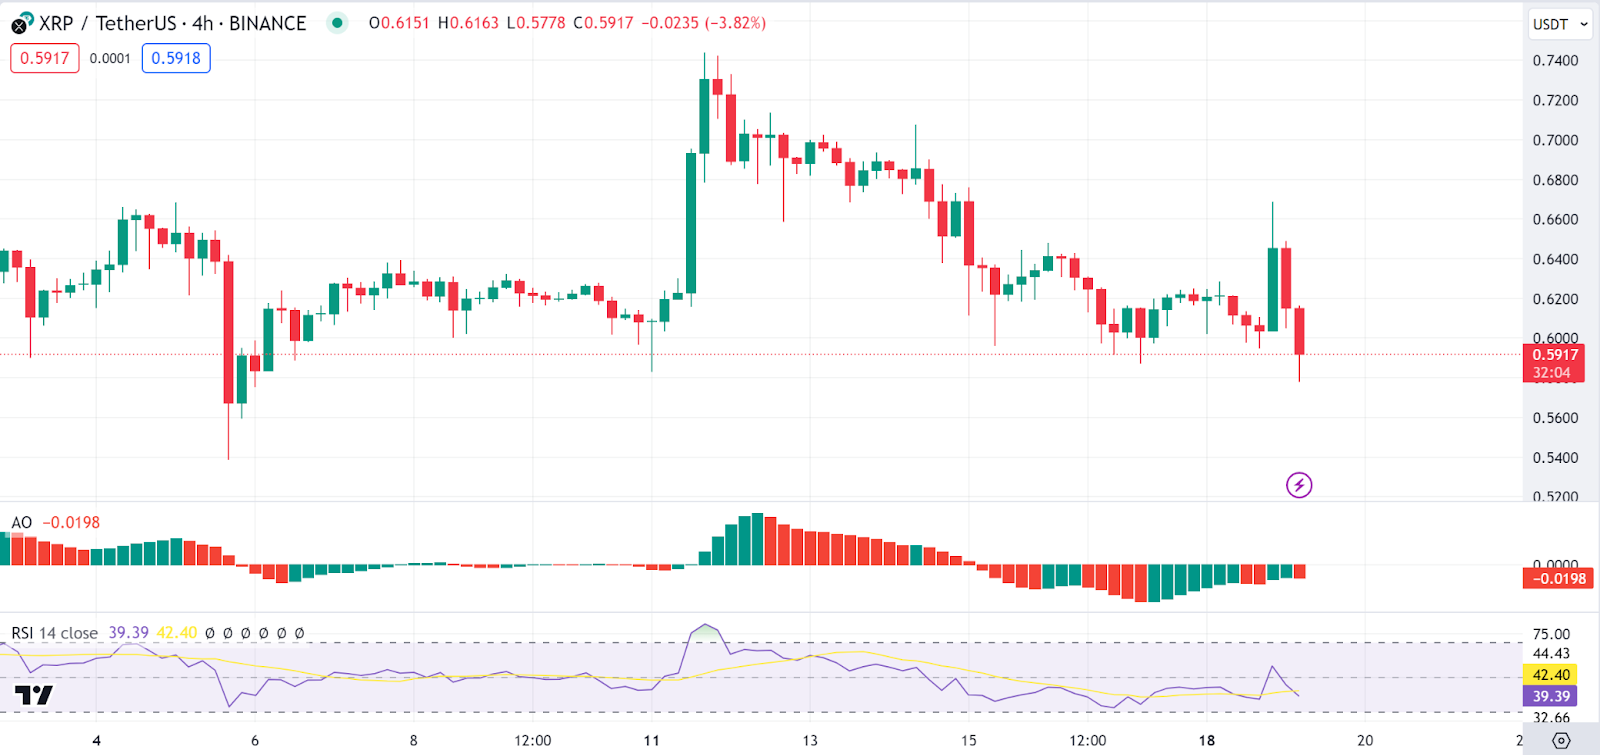
Ripple Price Review
Ripple (XRP), wrapping up our list, has fallen prey to today’s bear market. The is showing significant volatility with sharp upward and downward price movements. The Awesome Oscillator (AO) is slightly below zero, which suggests bearish momentum is present.
The RSI is around 42, similar to BTC, indicating potential selling pressure but not in an oversold territory. The Ripple price stood at $0.5928 as of press time representing a 4.47% drop over the last 24 hours.