As Solana (SOL) continuously increases the number of unique transaction signers, the blockchain’s intrinsic vitality comes to light. SOL prices have responded positively with a sharp uptick in decentralized exchange (DEX) trades over the past two weeks.
Will these indicators keep the SOL price momentum in an uptrend?
Solana’s RSI Is at Healthy Levels
Solana Relative Strength Index (RSI), consistently around 48, indicates limited selling pressure. It’s not enough to deem the asset undervalued or to propel it into overbought territory. This equilibrium suggests Solana might be on the verge of a pivotal moment, poised for a directional price shift.
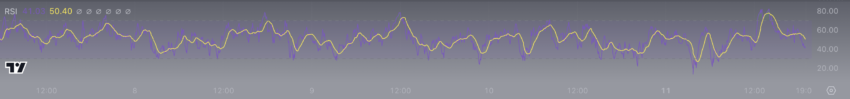
The RSI is a tool that gauges the velocity and magnitude of price movements, operating within a scale from zero to 100. Generally, readings above 70 signal an asset is potentially overbought, while those below 30 suggest it might be oversold. Solana’s RSI hovering near 48 positions, slightly below the midpoint, implying a subtle tilt away from a neutral market stance.
Such a balanced RSI level can lead to several scenarios for Solana. It could be a market consolidation, with stability in price, as the market appears to be in a holding pattern. Traders and investors might closely monitor the asset, waiting for definitive signs or triggers that could indicate the direction of the next significant price movement.
However, other metrics suggest the second case, which would be an anticipation of a breakout, where the uptrend will continue despite the RSI being above 30.
Solana Could Reach 1 Million Daily Users Soon
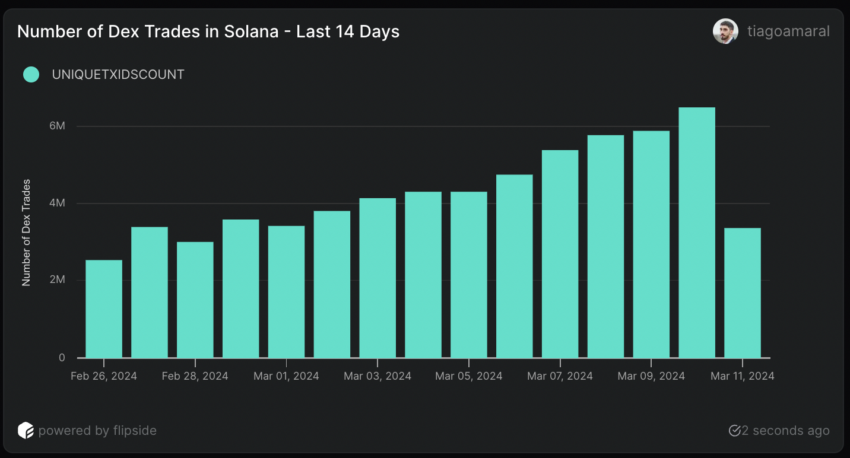
Solana’s on-chain data shows us two interesting metrics. The first is the staggering number of DEX trades, reaching 6.5 million on March 10. This is the biggest number of daily DEX Trades on Solana ever, and since February 26, the number of trades on decentralized exchanges in the Solana ecosystem has been growing consistently, always keeping above 2 million per day. Before December 2023, the biggest daily number of DEX Trades on Solana was 2.2 million.
This suggests that users increasingly engage with dApps on Solana, leading to higher use of SOL for trading tokens on its decentralized exchanges. Consequently, this heightened activity and speculation on SOL could directly influence its price.
Another interesting on-chain metric to check is the Daily Unique Transaction Signers. In simple terms, the number of unique users transitioning in the network daily.
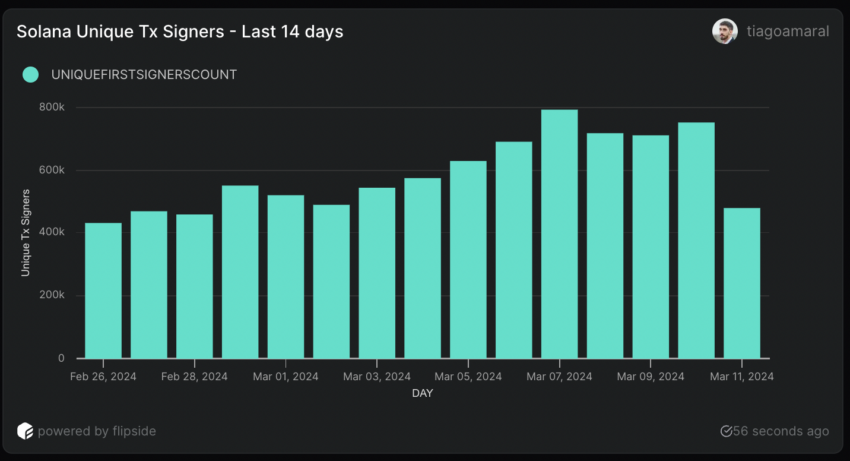
This number has been growing consistently since January 2024. On February 26, that metric registered 432,000 users. On March 7, it grew to almost 800,000, an 85% growth. That growth in less than a month is worth noticing for a chain already as big as Solana.
Following that same growth rate for the next weeks could take Solana’s Daily Unique Users to 1,000,000 in less than 14 days.
SOL Price Prediction: Eyeing $200
Solana (SOL) demonstrates a resistance level of $150 and a support threshold of $148.00. These critical levels have been pinpointed based on historical price movements where Solana has consistently met with significant buying or selling resistance.
Penetrating the resistance mark of $150 could potentially launch Solana into a fresh bullish trend, possibly reaching as high as $200. This upward momentum could be fueled by an influx of users joining the Solana network and increased trading activities on decentralized exchanges (DEXs) associated with the network.
Even after Binance suspended Solana withdrawals, this didn’t affect the SOL price much.
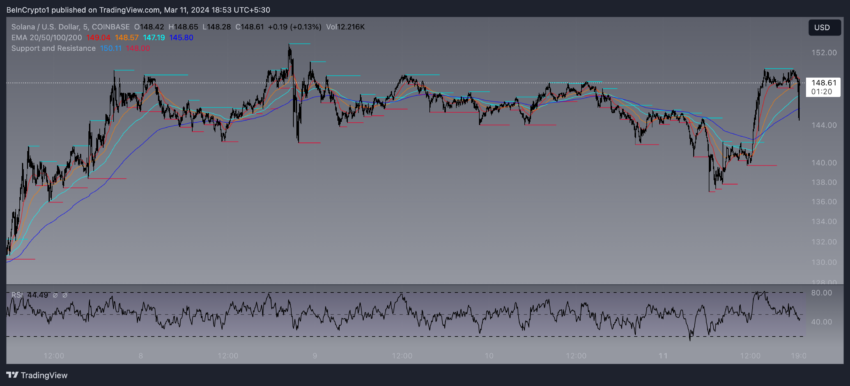
On the flip side, should Solana fail to maintain its footing above the support level of $144, there’s a risk that the price may slide downwards toward $140; it could retreat further to hit the $138 mark. Monitoring these support and resistance levels closely is crucial, as they can offer insights into SOL’s near-term price trajectory in the cryptocurrency market.
Analyzing the EMA (Exponential Moving Average) Cross for 20, 50, 100, and 200 days shows us that shorter-term EMAs are crossing above the longer-term EMAs, a bullish signal. This indicates that the SOL price can continue to rise over the next few days.