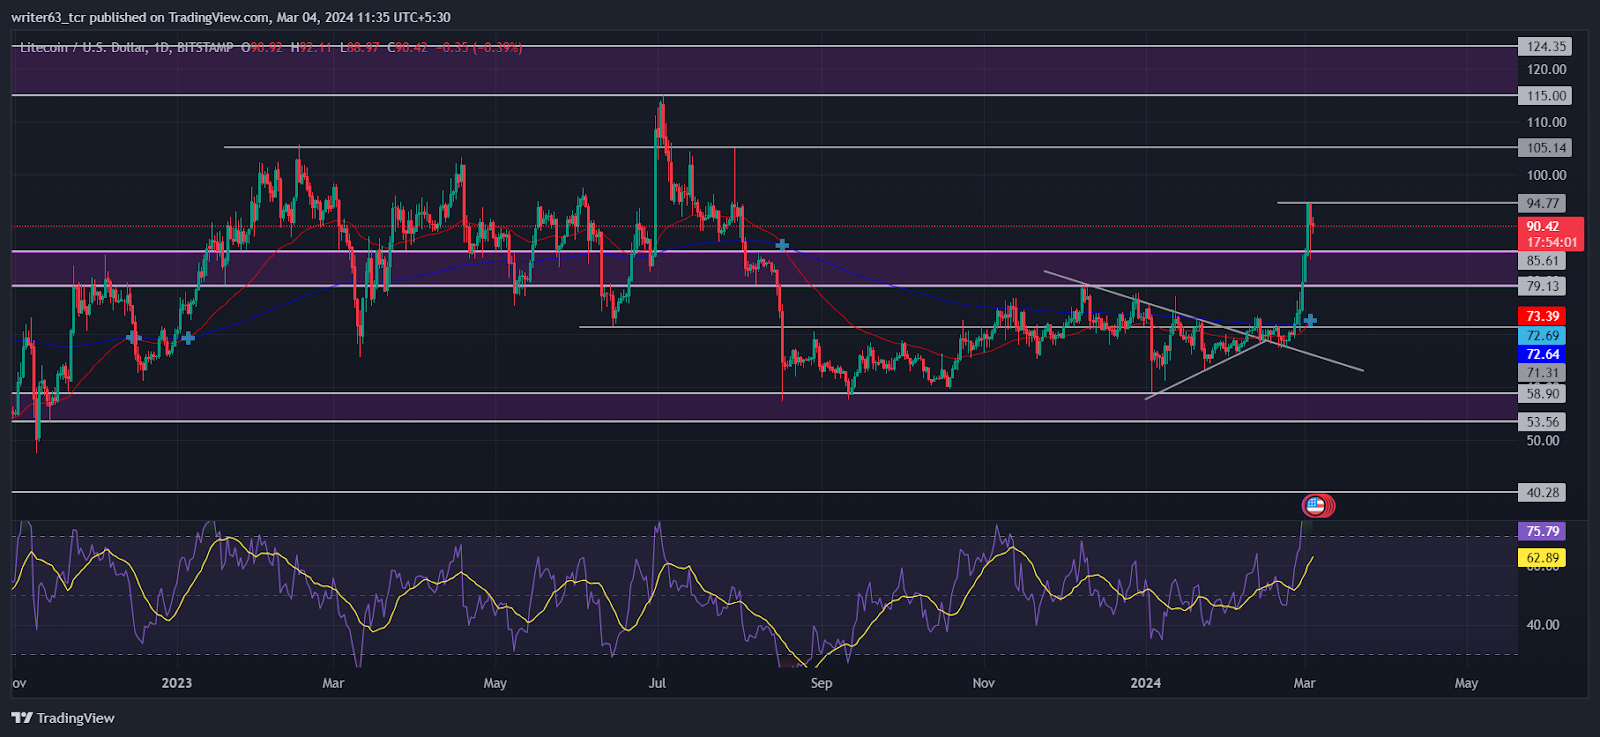
- 1 $LTC coin price has given a breakout from a peanut pattern in the daily timeframe.
- 2 Technical indicators summary suggested a positive signal in the current phase.
- 3 The volume of Litecoin has declined by 22.21% in the last 24 hours.
Litecoin ($LTC) is a cryptocurrency created based on the Bitcoin (BTC) protocol. The protocol provides fast, secure, and low-cost payments by leveraging the unique properties of blockchain technology. $LTC differs from Bitcoin regarding the hashing algorithm used, hard cap, and block transaction. Litecoin uses a proof-of-work (PoW) consensus algorithm to confirm transactions quickly and without errors.
$LTC Coin Price Reflected Sustainability in Returns
On November 10, 2023, the $LTC coin price made a significant U-turn from the $53.56 support level. The price of Litecoin surged by over 70% to the $85.61 resistance level.
The rally reflected an essential change in market sentiments.
Conversely, the buyers are also attracted by this change. During this rally, the price made a bullish point of interest (POI) on the $61.96 level. Crypto traders took it as an opportunity, which resulted in a hike of 72% to the $105.14 resistance level.
The hike made $65.94, a strong demand level that later served as a trampoline for bulls to another ride. Consequently, the price grew 73%, reaching the $115.00 crucial supply level. However, the price swiped the external liquidity and fell to the $58.90 support.
And now, the $LTC coin price has recovered nearly 50% from the $115.00 supply level. Litecoin’s current market capitalization stands at $6.75 Billion, ranked 19th out of all the 8,873 active cryptocurrencies registered on CoinMarketCap.
Technical Analysis of $LTC Coin Price

$LTC coin price is moving above the 50 and the 200-Day EMAs, highlighting an uptrend. Both EMAs made a bullish crossover at the $72.69 level, which boosted the $LTC price in recent trading sessions. The 50-Day EMA is at $73.40, and the 200-Day is moving at $72.64.
The $LTC coin price started a bullish rally from the $58.90 support level. The price surged by over 34% to the $79.13 bearish decisional point of interest, which reacted as a supply level. It fell to the $58.90 demand level and formed a peanut pattern.
On February 8, 2024, the price broke the peanut pattern at $70.67 and retested the trendline. The price moved to the $94.77 level by forming impulsive bullish candles. It broke above the $85.61 supply level and is aiming for the $115.00 resistance.
Moreover, the relative strength index (RSI) reflected an internal bullish divergence in the momentum. It indicates that the buyers hold the upper hand in the current trading phase. The RSI is moving at 76.58 above the signal line.
Summary
The $LTC coin price is moving in an uptrend after the bullish crossover between EMAs. The price has given a breakout from a peanut pattern and rose above the $85.61 supply level. Per the technicals, the price is aiming for the $115.00 crucial resistance level.
Technical Levels
- Resistance Levels: $105.14 and $124.35
- Support Levels: $79.13 and $65.94
Disclaimer
The views and opinions stated by the author, or any people named in this article, are for informational purposes only. They do not establish financial, investment, or other advice. Investing in or trading stocks and crypto comes with a risk of financial loss.
Anurag is working as a fundamental writer for The Coin Republic since 2021. He likes to exercise his curious muscles and research deep into a topic. Though he covers various aspects of the crypto industry, he is quite passionate about the Web3, NFTs, Gaming, and Metaverse, and envisions them as the future of the (digital) economy. A reader & writer at heart, he calls himself an “average guitar player” and a fun footballer.
 thecoinrepublic.com
