
Over the last few weeks, the broader crypto market has experienced major upside with Bitcoin ($BTC) hitting $64,000 at one point. However, apart from Bitcoin’s jump, there have been several cryptocurrencies that have been in the spotlight and performed exceptionally. Here are the top five best-performing coins in the top 100.
Worldcoin ($WLD)
Worldcoin’s ($WLD) price increased by 217.82% in the last 30 days. At a particular time, the price of the token crossed $9. However, in the last seven days, the upward trajectory had cooled, and at press time, Worldcoin changed hands at $7.72.
Based on the 4-hour $WLD/USD chart sellers might have gotten exhausted with support appearing at $7.25. However, a build-up back to $9 could be challenging considering the solid resistance at $8.
A successful close above $8 could see $WLD head for a new all-time high, jumping toward $10. However, rejection at the region could spell another nosedive for the token. At press time, the RSI had fallen below the 50.00 midpoint, nearing the oversold region.
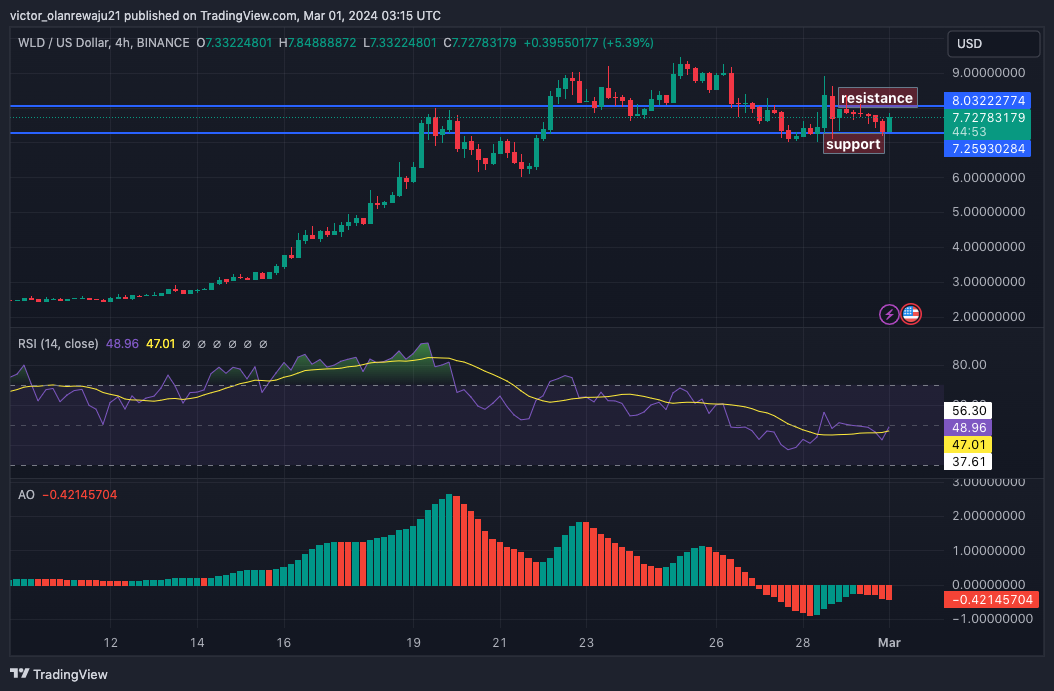
If the RSI reading continues to decrease, $WLD’s price could slide below $7. Should the token get oversold, a bounce above $9 could be next. Furthermore, the Awesome Oscillator (AO) reading was negative, suggesting increasing downward momentum.
Arweave (AR)
AR’s price at press time was $27.18, thanks to a 209.04% 30-day increase. As a result of the hike, the native token of the decentralized storage network has been able to move up to number 52 on the market cap standings.
From the technical perspective, volatility around AR has been extreme, according to indications from the Bollinger Bands (BB). This extreme volatility implies that price fluctuations could be massive. However, the token was overbought as the upper band of the BB tapped its price around $30.
In a highly bearish scenario, AR could slip below the $20 region. However, increased buying pressure could drive the price higher toward $35. Like the BB, the Money Flow Index (MFI) reinforced the notion that the token had hit overbought levels.
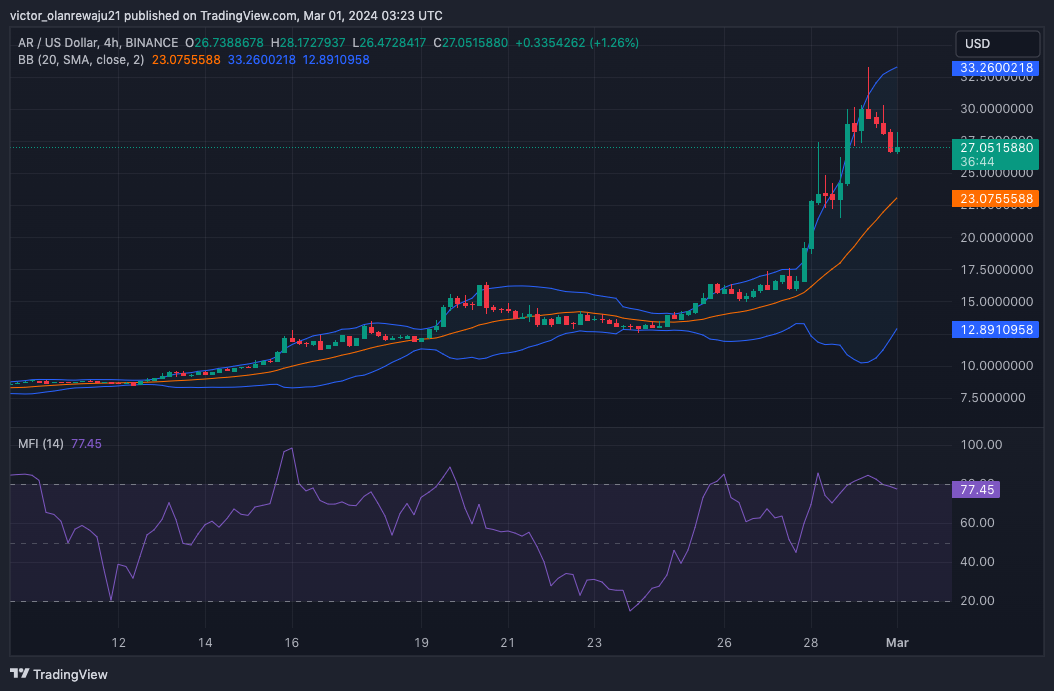
Therefore, further retracement could be likely. On the other hand, if altcoins begin to move higher than usual, AR could also follow and a return to the upside might occur in the short term.
Pepe ($PEPE)
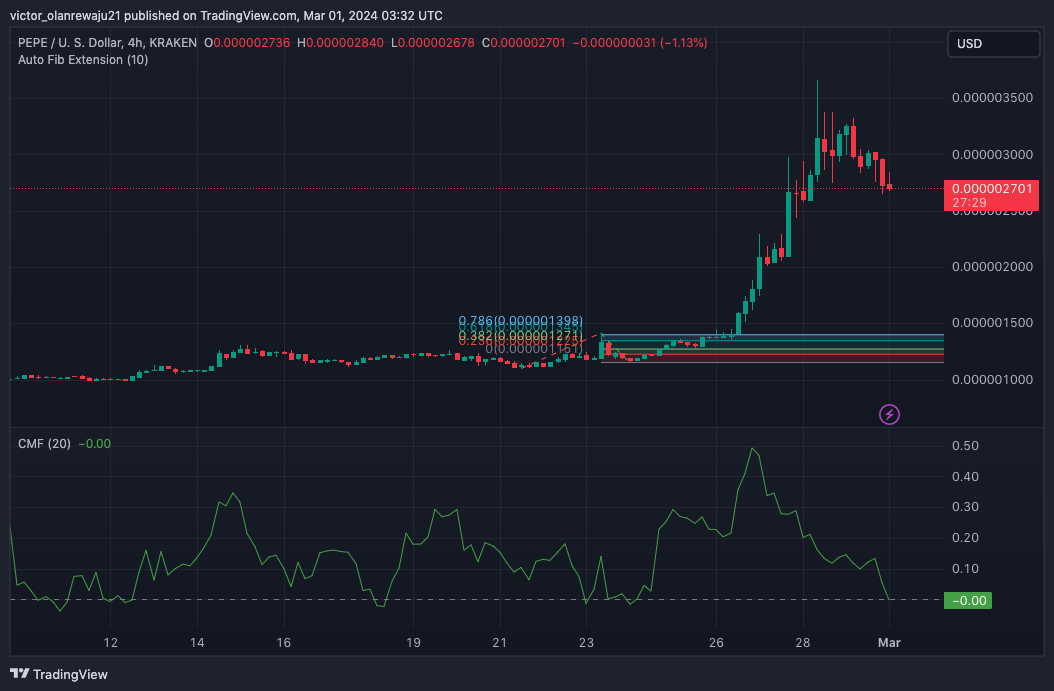
As Coin Edition recently reported, $PEPE’s 178% jump made it the best-performing memecoin in the top 100. At press time, the price of the cryptocurrency was $0.00000271, and recently, it hit an all-time high.
However, $PEPE seemed to be undergoing a profit-taking period based on the 4-hour outlook. For instance, the Chaikin Money Flow (CMF) had fallen hard into the negative region. This negative reading implies that there was no more strength behind $PEPE’s previous uptrend.
Instead, the price action might continue to trend downward. If this is the case, $PEPE’s price might nosedive to $0.0000020. A look at the Fibonacci retracement showed that if selling pressure is intense, the price could fall as low as $0.0000013 where the 0.618 and $0.786 Fib levels were positioned.
Fetch.ai ($FET)
$FET continued to show its prowess as one of the top AI-themed cryptocurrencies of this cycle. In the last 30 days, $FET’s price has increased by 170.78%. Also, the result of this hike meant that the price was now trading above $1.58.
Between February 22 and 28, $FET was in a consolidation phase as the price struggled to move above $1.19. However, bulls found support at $1.05 and capitalized on it with increased buying pressure.
As it stands, $FET’s price could rise higher due to the signals from the On Balance Volume (OBV). At press time, the OBV reading increased. Also, the Moving Average Convergence Divergence (MACD) was positive, indicating a bullish momentum.
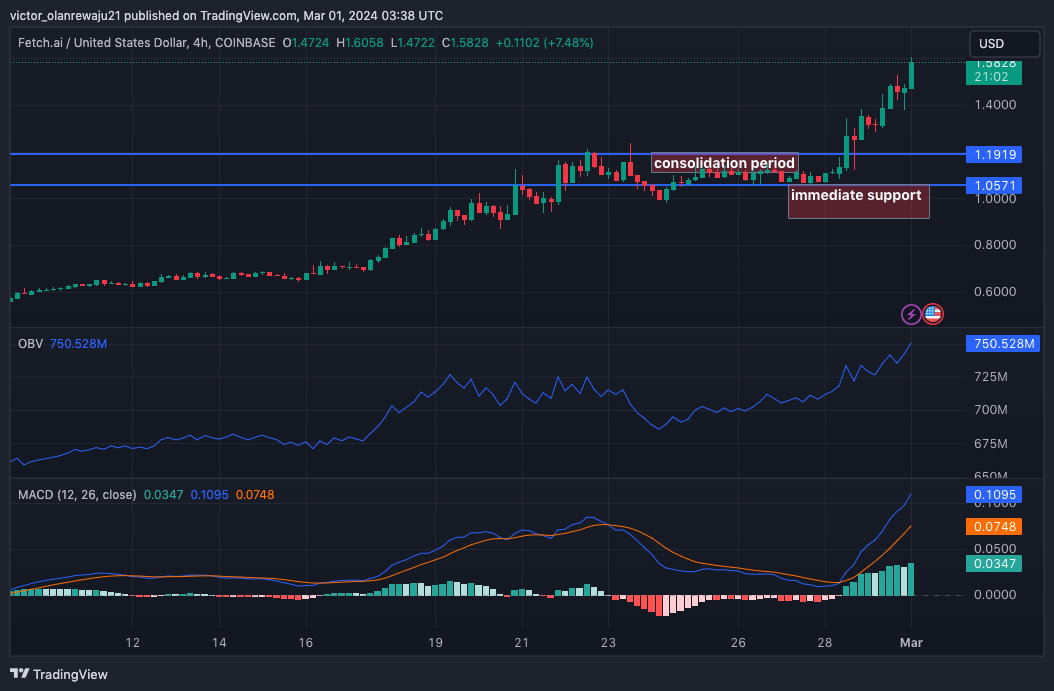
In the short term, $FET might cross the $2 mark before the northward movement cools off for a while.
Flare ($FLR)
A 100% increase in the last 30 days implied that Layer 1 token Flare ($FLR) traded at $0.04. However, the MACD revealed that the bullish momentum had turned bearish as it slid into negative territory.
Furthermore, the 12-day EMA (blue) had crossed below the 26-day EMA (orange), suggesting that sellers had outpaced buyers’ dominance. Should this be the case going forward, $FLR’s price could drop by 15.62% which could place it at $0.039.
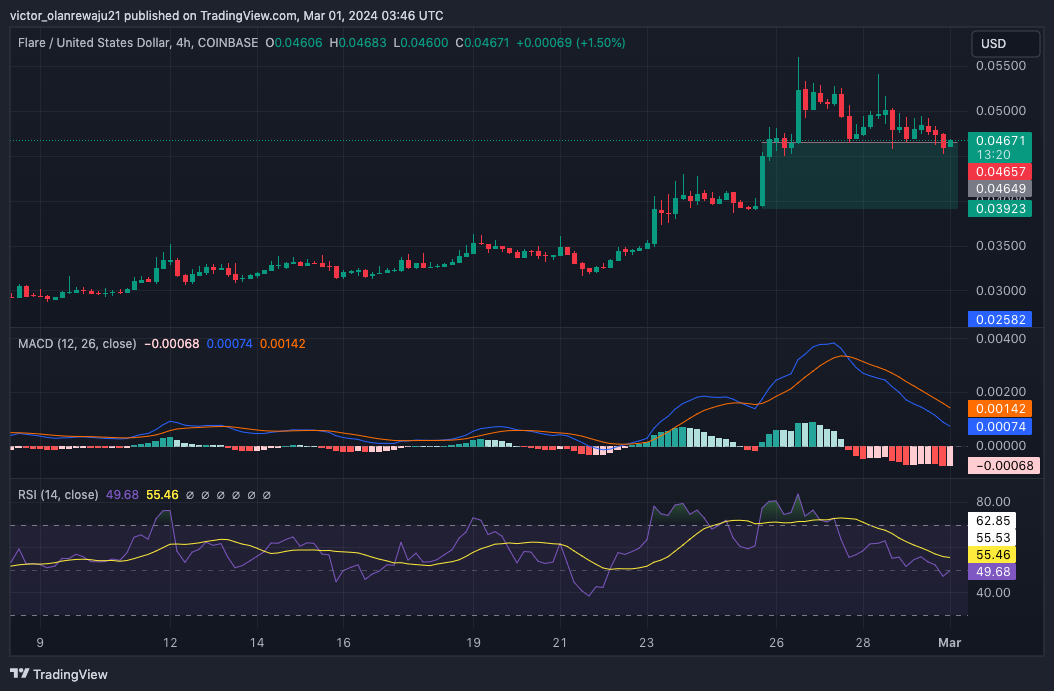
In addition, the RSI also fell below the midpoint, confirming the MACD selling pressure signal. However, the long-term prospect of $FLR could turn bullish if altcoins begin to dominate as $BTC falls.
Disclaimer: The information presented in this article is for informational and educational purposes only. The article does not constitute financial advice or advice of any kind. Coin Edition is not responsible for any losses incurred as a result of the utilization of content, products, or services mentioned. Readers are advised to exercise caution before taking any action related to the company.