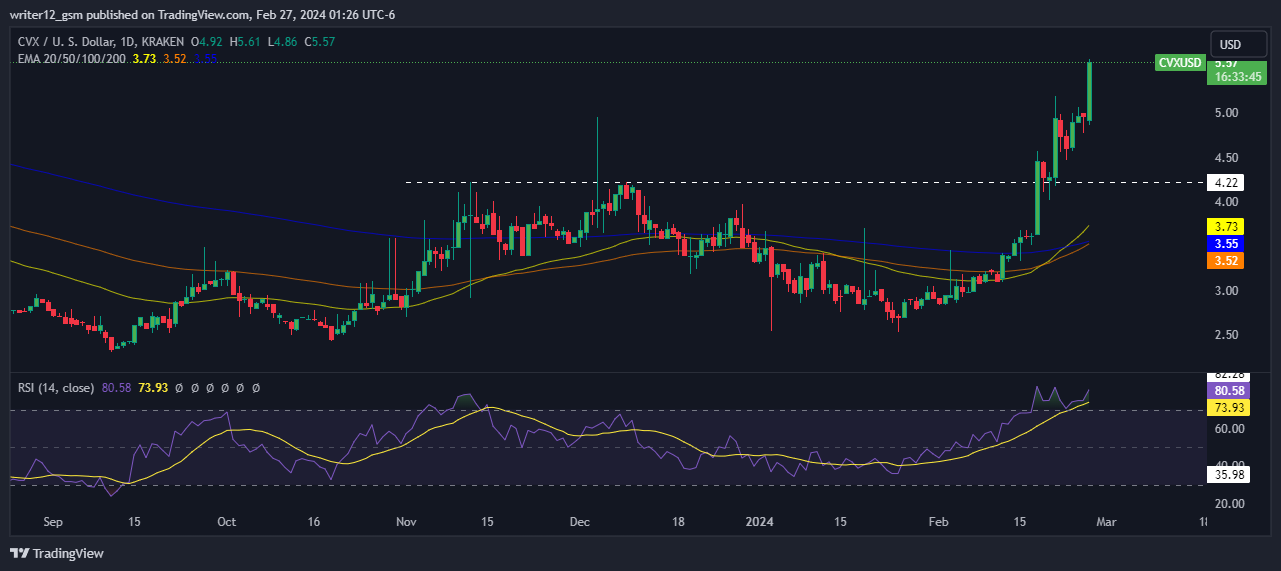
- 1 Convex Finance price prediction suggests the bullishness in the crypto price on the daily technical chart.
- 2 $CVX price is trading above the key moving averages showcasing the bullishness in the price.
- 3 The crypto is surging by almost 31% this week showing the buyers are dominating the sellers.
Convex Finance is trading in the bullish range above the key moving averages showcasing that the buyers are dominating the bears. $CVX price demonstrated a remarkable surge in the past months as the buyer’s confidence came back in the crypto.
Convex Finance ($CVX) is a DeFi protocol that runs on the Ethereum blockchain, mainly linked with Curve Finance. Its function is to improve staking rewards and yield optimization for $CRV token holders and Curve liquidity providers.
The platform is known for its method of decentralized asset management, using proof-of-stake mining and liquidity pools to distribute rewards.
Convex Finance enables Curve liquidity providers to earn a portion of trading fees on Curve without staking directly on the Curve platform. By staking with Convex, users can possibly receive more $CRV and liquidity mining rewards.
The platform’s design aims to simplify the staking process and increase potential returns for its users, but as with any DeFi protocol, it’s essential to acknowledge the inherent risks and volatility in such platforms.
Technical Analysis of the Convex Finance on Daily Technical Chart

Convex Finance is treading above the key moving averages showcasing the bullishness on the daily technical chart. Moreover, the 20, 50,100, and 200-Day EMAs are supporting the price.
The super trend indicator is in the fovour of the bulls showing the green signal to the price showcasing the bullishness on the daily chart. Another indicator Bollinger band also demonstrates the bullishness on the daily technical chart as the price is trading near the upper Bollinger band.
The RSI curve is also pointing towards the extreme bullishness in the price as the bulls are in the power and the RSI curve is hovering at the level of 80. The MACD curve is hovering in the bullish zone with the green bars on the histogram and the bullish crossover between the signal line and the MACD curve.
Summary
Convex Finance (USD: $CVX) technical oscillators and indicators support the bullish momentum. The MACD, RSI, and EMA are highlighting positive indications and suggest that the bullish trend may continue in the $CVX crypto price. Moreover, Convex Finance crypto can go higher if it gets the desired support from buyers. Meanwhile, $CVX is experiencing a bullish rally, and overall the indicators are showcasing the bullishness in the crypto price
Technical Levels
Support Levels: $4.20 and $3.70
Resistance Levels: $6.00 and $7.00
Disclaimer
This article is for informational purposes only and does not provide any financial, investment, or other advice. The author or any people mentioned in this article are not responsible for any financial loss that may occur from investing in or trading. Please do your own research before making any financial decisions.
With a background in journalism, Ritika Sharma has worked with many reputed media firms focusing on general news such as politics and crime. She joined The Coin Republic as a reporter for crypto, and found a great passion for cryptocurrency, Web3, NFTs and other digital assets. She spends a lot of time researching and delving deeper into these concepts around the clock, and is a strong advocate for women in STEM.
 thecoinrepublic.com
