
When it comes to $XRP's recent price performance, legendary trader Peter Brandt offers a succinct verdict: "Nothing stands out to me." This sentiment reflects $XRP's recent chart, which shows a lack of significant movement or distinct patterns that could captivate a trader's interest.
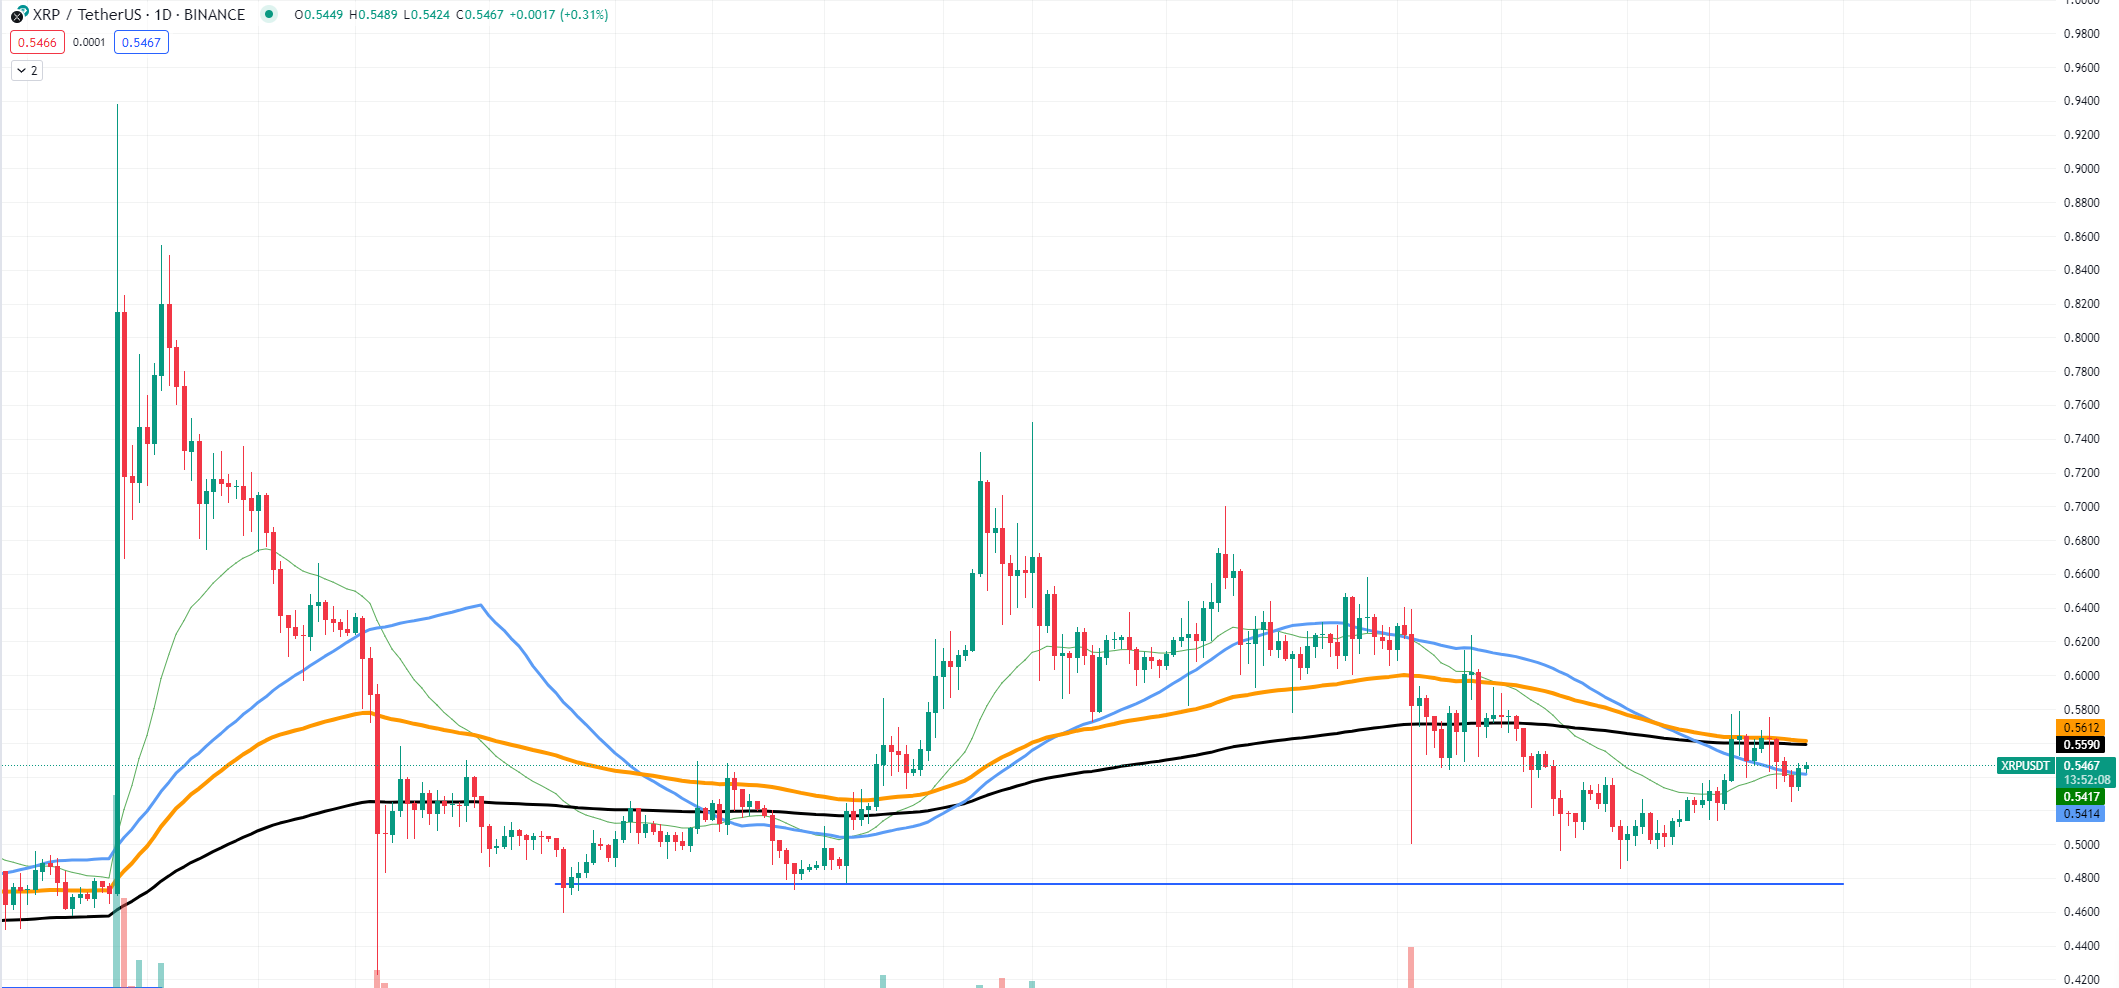
The monthly bars on the $XRP/USD chart illustrate a currency in stagnation, with the price hovering around $0.54610. The moving averages (MA), which traders often use to gauge momentum and trend strength, provide little in the way of direction.
The 18-month MA has flatlined, suggesting a lack of bullish or bearish conviction among investors. The asset is trading in a tight range without notable highs or lows, making it challenging to forecast with any degree of certainty.
Considering the future of $XRP, let's envision two scenarios: one for growth and another for decline. For growth, $XRP would need to break and hold above the psychological resistance level of $0.60. If it succeeds, the next threshold would be to tackle the $0.65 mark, which, if surpassed, could pave the way for a test of the $0.70 resistance zone.
Conversely, a drop scenario would see $XRP breaching support levels. The first key level to watch is $0.50. A sustained move below this could signal a bearish trend toward the $0.45 mark.
If bearish momentum continues and $XRP breaks past this point, the door would open to a descent toward the more substantial support area of $0.40, a level not seen since the latter part of 2020.
For either scenario to unfold, there would need to be a departure from the current "dullness." This could be influenced by broader market trends, regulatory news concerning Ripple, or shifts in investor sentiment. Until then, $XRP's performance is characterized by its horizontal movement on the chart, offering little in the way of excitement or opportunity for traders like Brandt.