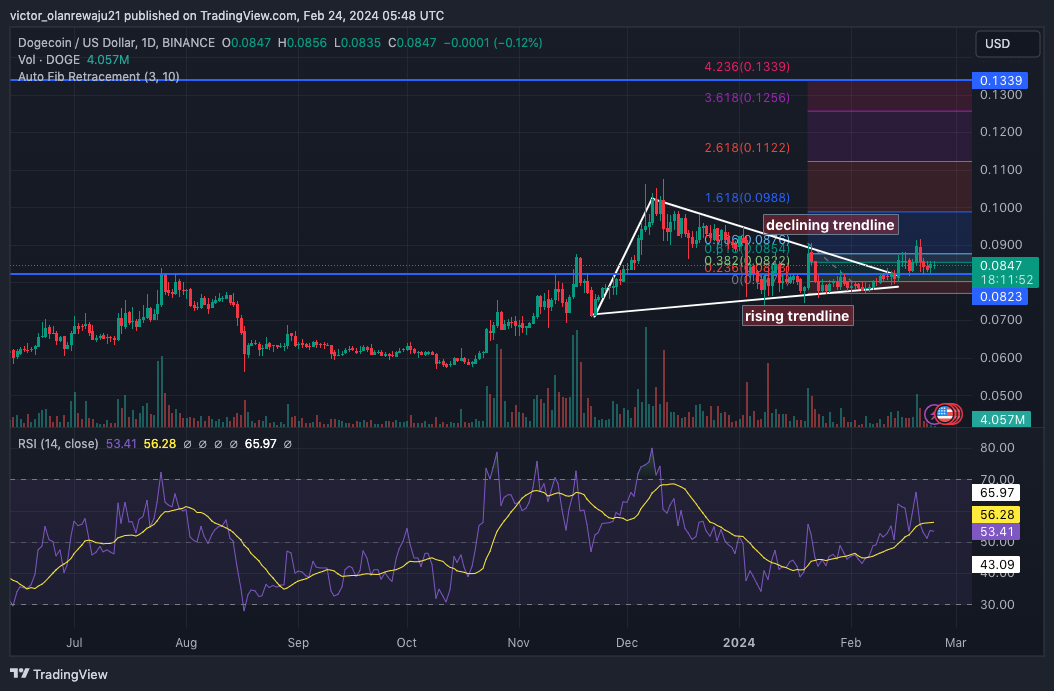
Dogecoin ($DOGE) formed an asymmetrical triangle on the daily chart, underscoring how bulls have been trying to keep the price above $0.090. However, the attempts by bulls have been unsuccessful as bears tugged back the price.
The asymmetrical triangle formation suggests that a breakout could be ahead for $DOGE. But before the potential rally, $DOGE’s price might slide. At press time, the price of the cryptocurrency was $0.084.
Bulls and Bears Battle It Out
Indications from the Relative Strength Index (RSI) signaled a drop in bullish dominance. Should the RSI reading drop below 50.00, then $DOGE might decrease to $0.080. However, bulls would likely try and drive the price upwards.
For instance, if bears tug back the price, Dogecoin could slip to $0.0823 where the 0.236 Fibonacci retracement was located. If the price rebounds from this level, $DOGE could start an uptrend to $0.133 where the 4.236 Fibonacci retracement was positioned.
On the other hand, the bullish thesis could be invalidated if the price turns down below $0.080. A scenario like that would suggest bearish dominance amid rising selling pressure. Should this be the case, $DOGE might descend toward $0.071, and this might make it difficult to experience a major relief.

$DOGE to $10? Analyst Explains Thesis
Recently, analyst Ali Martinez posted on X that $DOGE’s breakout could be much higher than a rise to $0.133. According to Martinez, the coin had formed a pattern on the weekly chart that was similar to the one it had in 2020.
During that period, Dogecoin’s price pumped by 28,770%. The analyst, in his post, also opined that $DOGE’s potential breakout of the descending triangle could trigger another bull run for the coin. From the chart he shared, he suggested that $DOGE could get close to $10 at some point.
The price action of #Dogecoin is showing familiar patterns reminiscent of its 2020 behavior. Back then, $DOGE broke out from a descending triangle, entered a period of consolidation, and then skyrocketed by 28,770%.
— Ali (@ali_charts) February 23, 2024
Currently, #$DOGE appears to be mirroring this pattern: having… pic.twitter.com/69yXnlYRJd
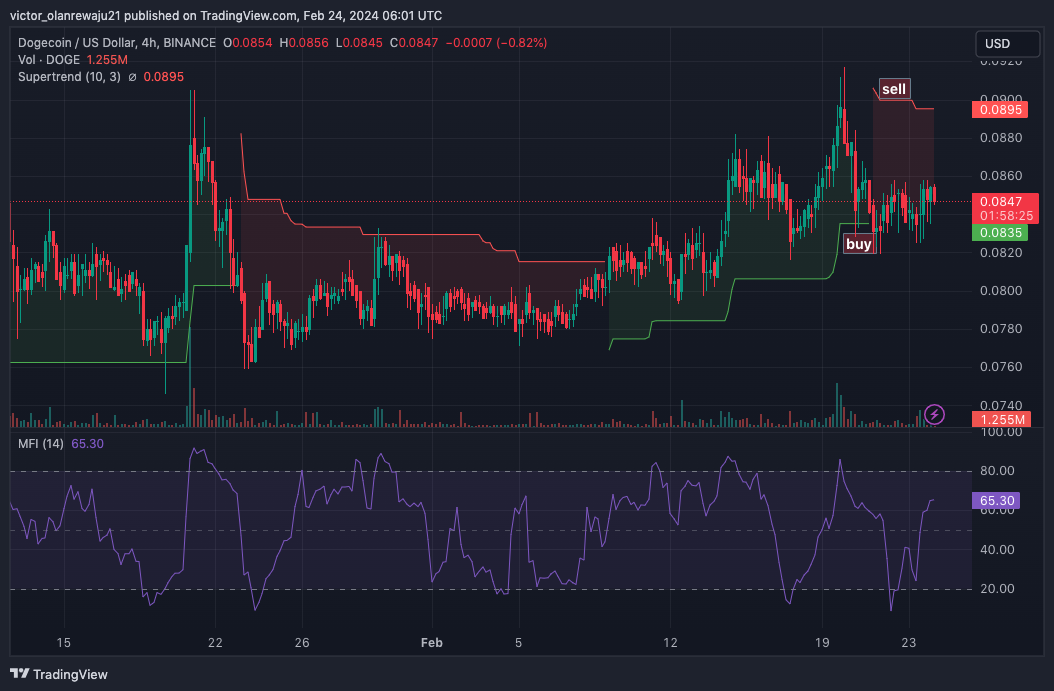
Meanwhile, the Supertrend indicator on the 4-hour $DOGE/USD chart showed a sell signal around $0.089, confirming why it was difficult for the coin to rise above $0.090. However, the indicator also flashed a buy signal at $0.083.
Therefore, traders who buy $DOGE around that level could be profitable if the price bounces off the lows. Furthermore, the Money Flow Index (MFI) had risen to $65.30, suggesting a surge in capital inflow.

This jump was also proof of buying pressure. If buying pressure continues to increase, then $DOGE’s price could be set for a big rally. Should the price break above $0.090, $DOGE could head towards a target of $0.13 in the short term.
Disclaimer: The information presented in this article is for informational and educational purposes only. The article does not constitute financial advice or advice of any kind. Coin Edition is not responsible for any losses incurred as a result of the utilization of content, products, or services mentioned. Readers are advised to exercise caution before taking any action related to the company.
 coinedition.com
