The global market cap recorded a 1.62% decrease on the last day to $1.95 trillion. The trading volume dropped by 13% to $72 billion as markets now seem to enter a consolidation face with bulls and bears struggling for dominance.
Bitcoin Price Review
Thef luctuates within the upper and lower bands, indicating volatility. The latest candlesticks near the lower band suggest potential support or a short-term bearish sentiment. On the other hand, the Simple Moving Average (SMA) is below the 20 SMA, offering a possible bearish trend in the short term.
The Relative Strength Index (RSI) is below the 50 mark, which can be seen as a bearish signal. It’s not in the oversold territory, so there might be room for further downside. The Bitcoin price was $51.03K, representing a 1.3% dump within 24 hours.

Ethereum Price Review
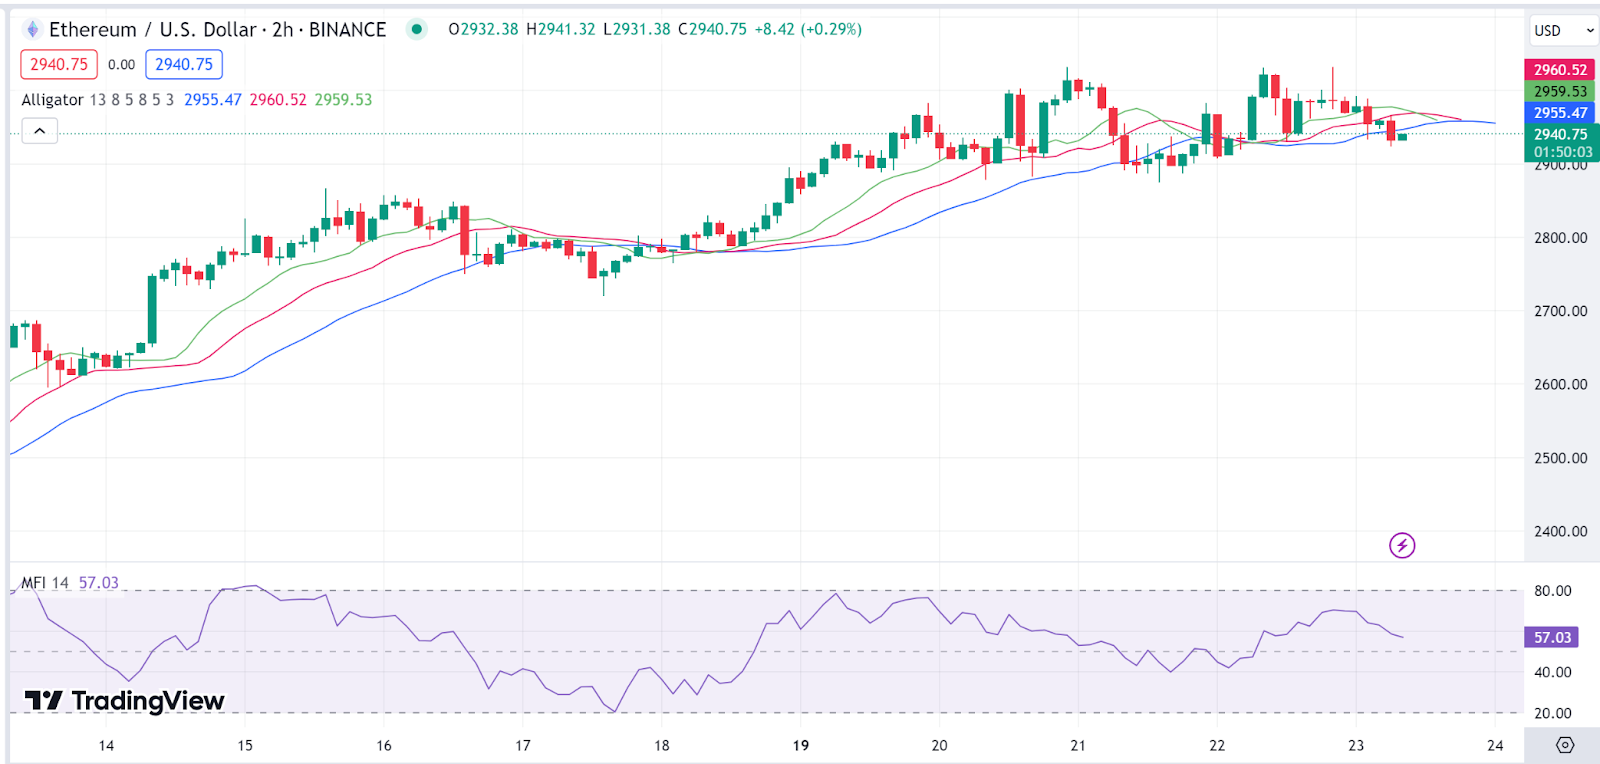
has also failed to post gains ahead of today’s adverse market conditions. The Alligator Indicator lines are closely intertwined, suggesting a lack of a clear trend and a possible consolidation phase.
The Money Flow Index (MFI) is above 50 but not overbought, indicating some buying pressure but not excessively. The Ethereum price was $2,929, representing a 2.2% dump within 24 hours.

Flare Price Review
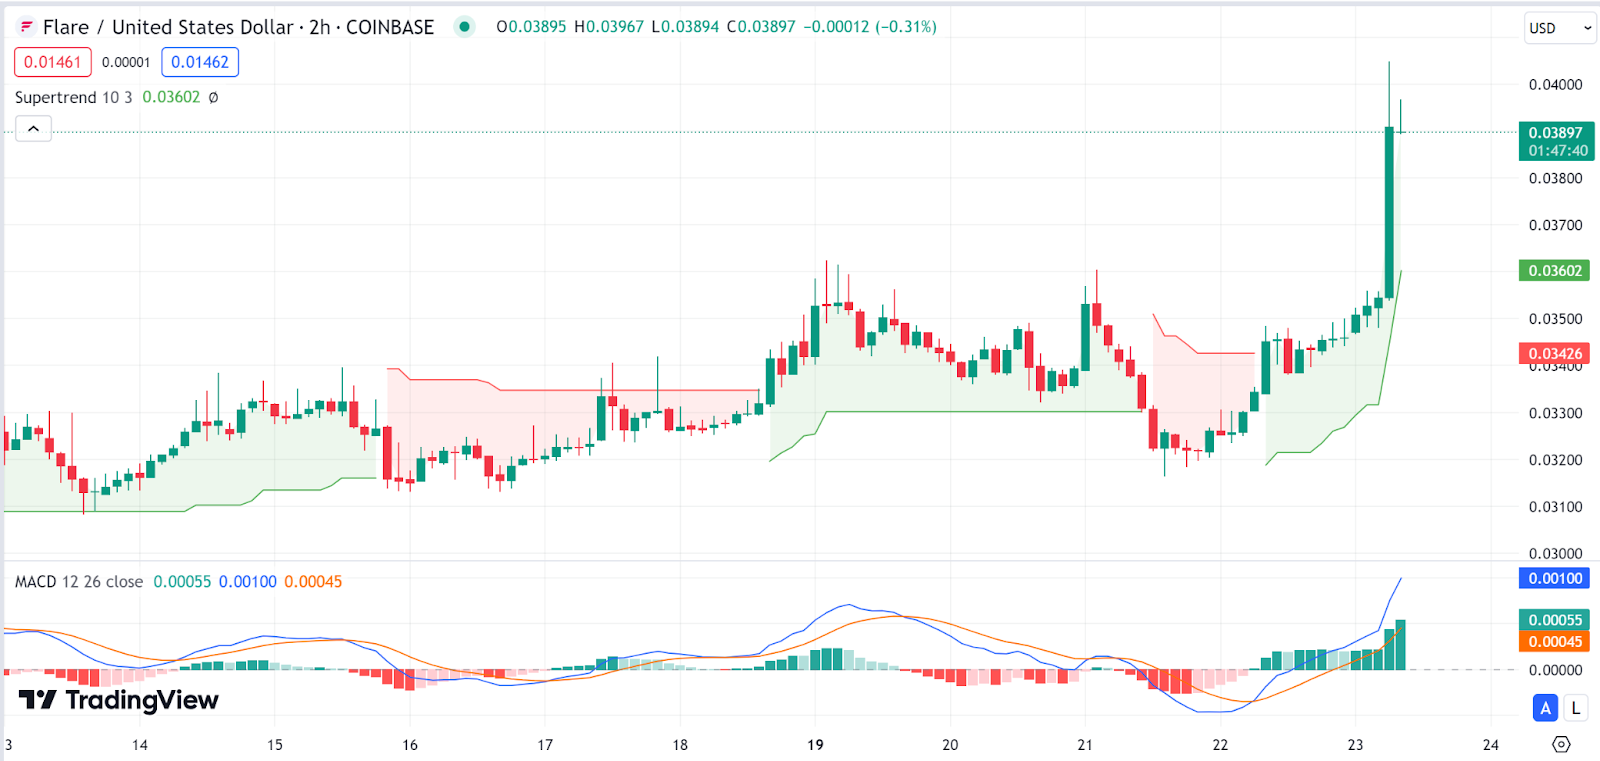
However, flare (FLR) has defied the odds to emerge as today’s top gainer. The recent green candlestick has broken above the SuperTrend line, suggesting a potential bullish reversal. The MACD line crosses above the signal line, and the histogram turns positive.
Both stand as bullish signs on the token as it looks to keep pumping in the short term. The Flare price was $0.394, representing a 17.3% pump within 24 hours.

WOO Price Review
Woo is another gainer today, as the altcoin also posted notable gains. The Money Flow Index (MFI) is relatively high, suggesting overbought conditions, which could precede a pullback on the WOO price.
On the flip side, the Awesome Oscillator (AO) bars are green and increasing in height, indicating strong bullish momentum. The WOO price was $0.4816, representing a 12.5% pump within 24 hours.

Mantle Price Review
Mantle is our third and last gainer in today’s bear market conditions. The Mantle price oscillates within the bands with recent candles near the upper band, suggesting potential resistance or a bullish sentiment in the short term.
Looking at the Woodies CCI, we notice it in the neutral zone, which does not provide a clear bullish or bearish signal on the token. The Mantle price was $0.7914, representing a 10% pump within 24 hours.

