The Crypto Market Cap (TOTALCAP) and Bitcoin (BTC) fell after yearly highs. SATS (1000SATS) is holding on above support.
In the news today:
- Stablecoin firm Circle discontinued USDC support on TRON amidst its push for an Initial Public Offering (IPO).
- Mathematician David Orrell argued that quantum mechanics, not Bitcoin, is the future of Economics.
TOTALCAP Shows Weakness
The cryptocurrency market cap has been moving upward since January 22. The increase culminated with a new yearly high of $1.95 trillion on February 20. However, the price has fallen slightly since.
A bearish divergence in the six-hour RSI (green trend line) preceded the decrease. Traders utilize the RSI as a momentum indicator to assess whether a market is overbought or oversold and whether to accumulate or sell an asset.
If the RSI reading is above 50 and the trend is upward, bulls still have an advantage, but if the reading is below 50, the opposite is true.
A bearish divergence occurs when a momentum decrease accompanies a price increase. It often leads to downward movements.
If TOTALCAP continues to fall, it can decrease by 5% and reach the 0.382 Fibonacci support level at $1.80 trillion.
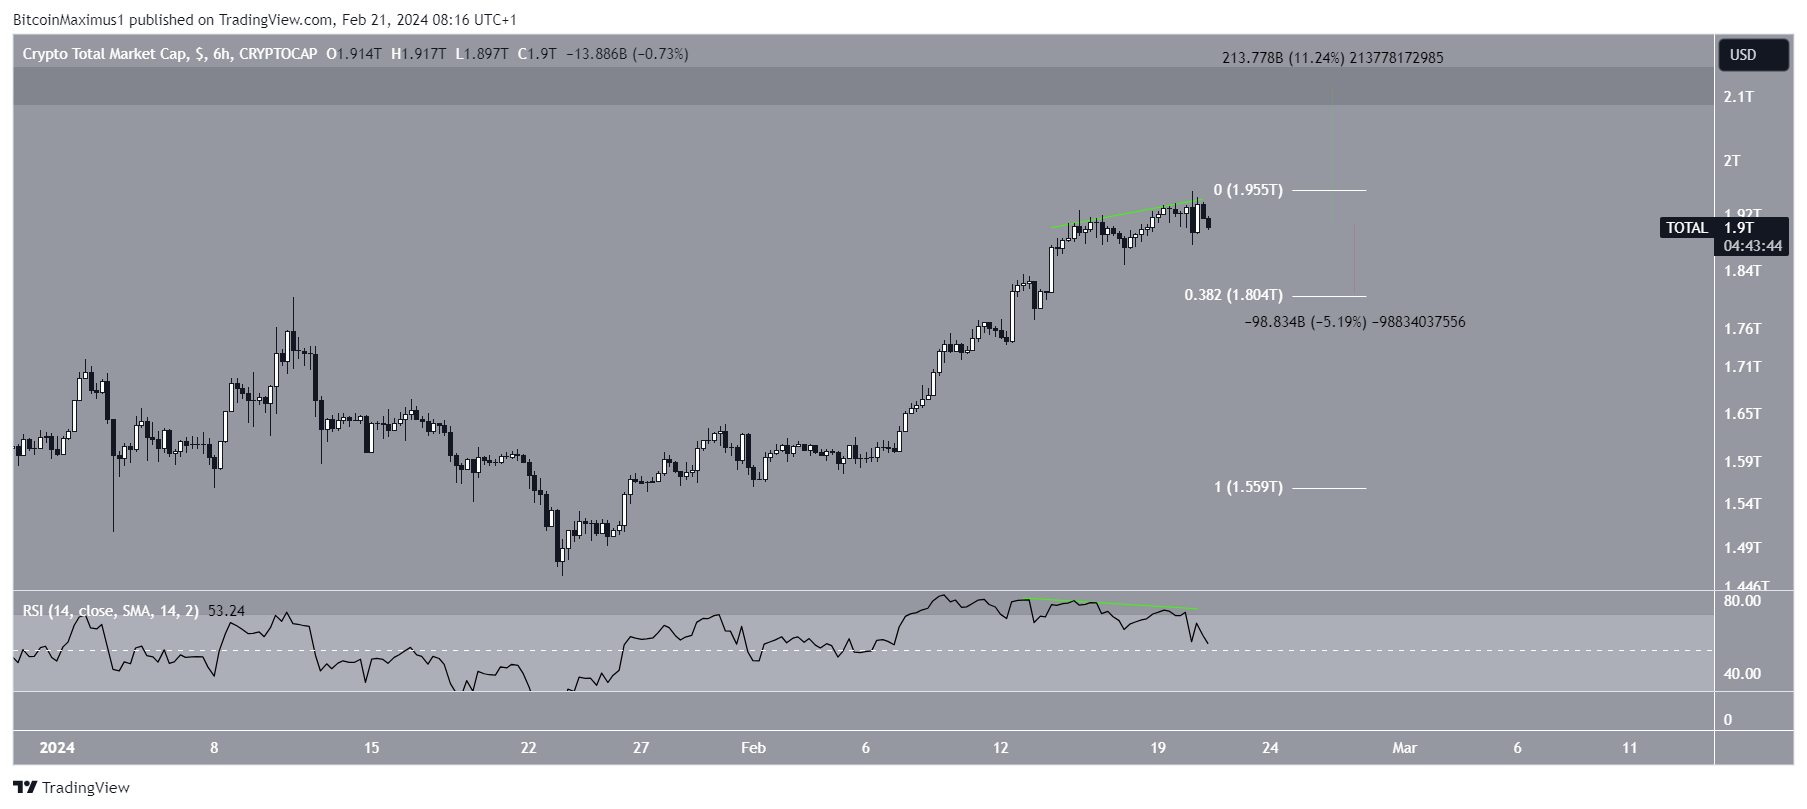
Despite this bearish TOTALCAP prediction, moving above the $1.95 trillion high can trigger an 11% increase to the next resistance at $2.10 trillion.
Bitcoin Deviates Above High
The Bitcoin price has also increased since January 22. The increase accelerated in February, culminating with a new yearly high of $53,000 on February 20.
However, BTC fell afterward, confirming a deviation above the previous range high (red icon). It has nearly returned to the $50,800 support.
Similarly to TOTALCAP, the downward movement was preceded by a bearish divergence in the two-hour RSI.
If BTC breaks down, it can fall 6% to the closest support at $48,500.
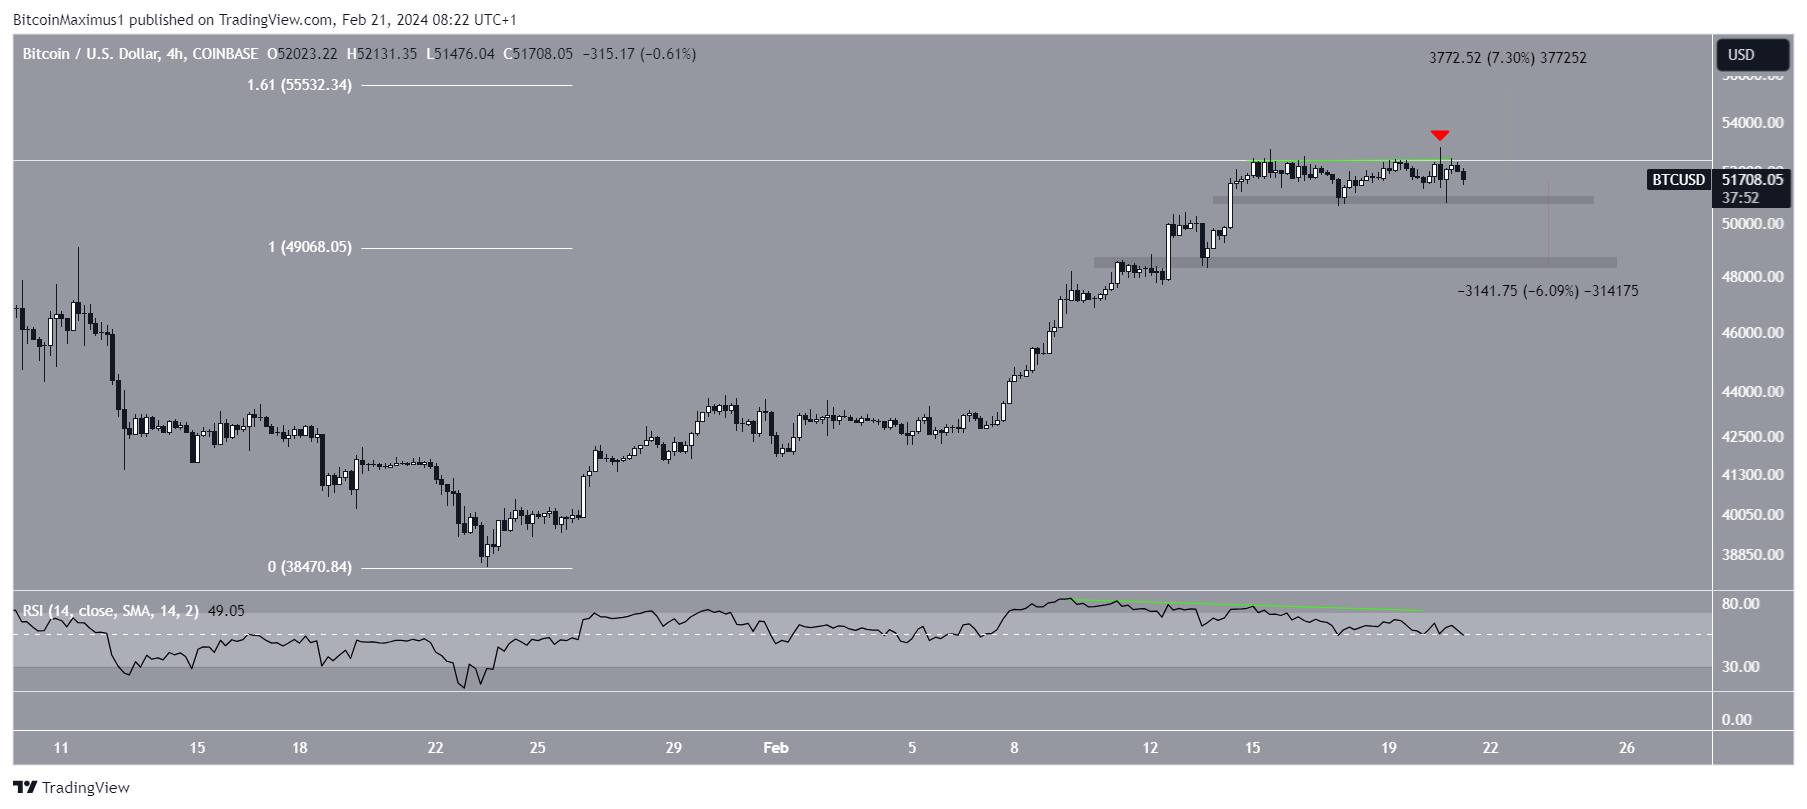
Despite this bearish Bitcoin price prediction, moving above the yearly high of $53,000 can catalyze a 7% increase to the next resistance at $55,500.
SATS Hangs Above Support
The SATS price has increased alongside an ascending support trend line since January 2024. While doing so, it was rejected by the $0.00055 resistance area twice (red icon). Most recently, the area rejected it on February 18, initiating the current downward movement.
Today, SATS returned to the ascending support trend line. Whether it bounces or breaks down can determine the future trend’s direction.
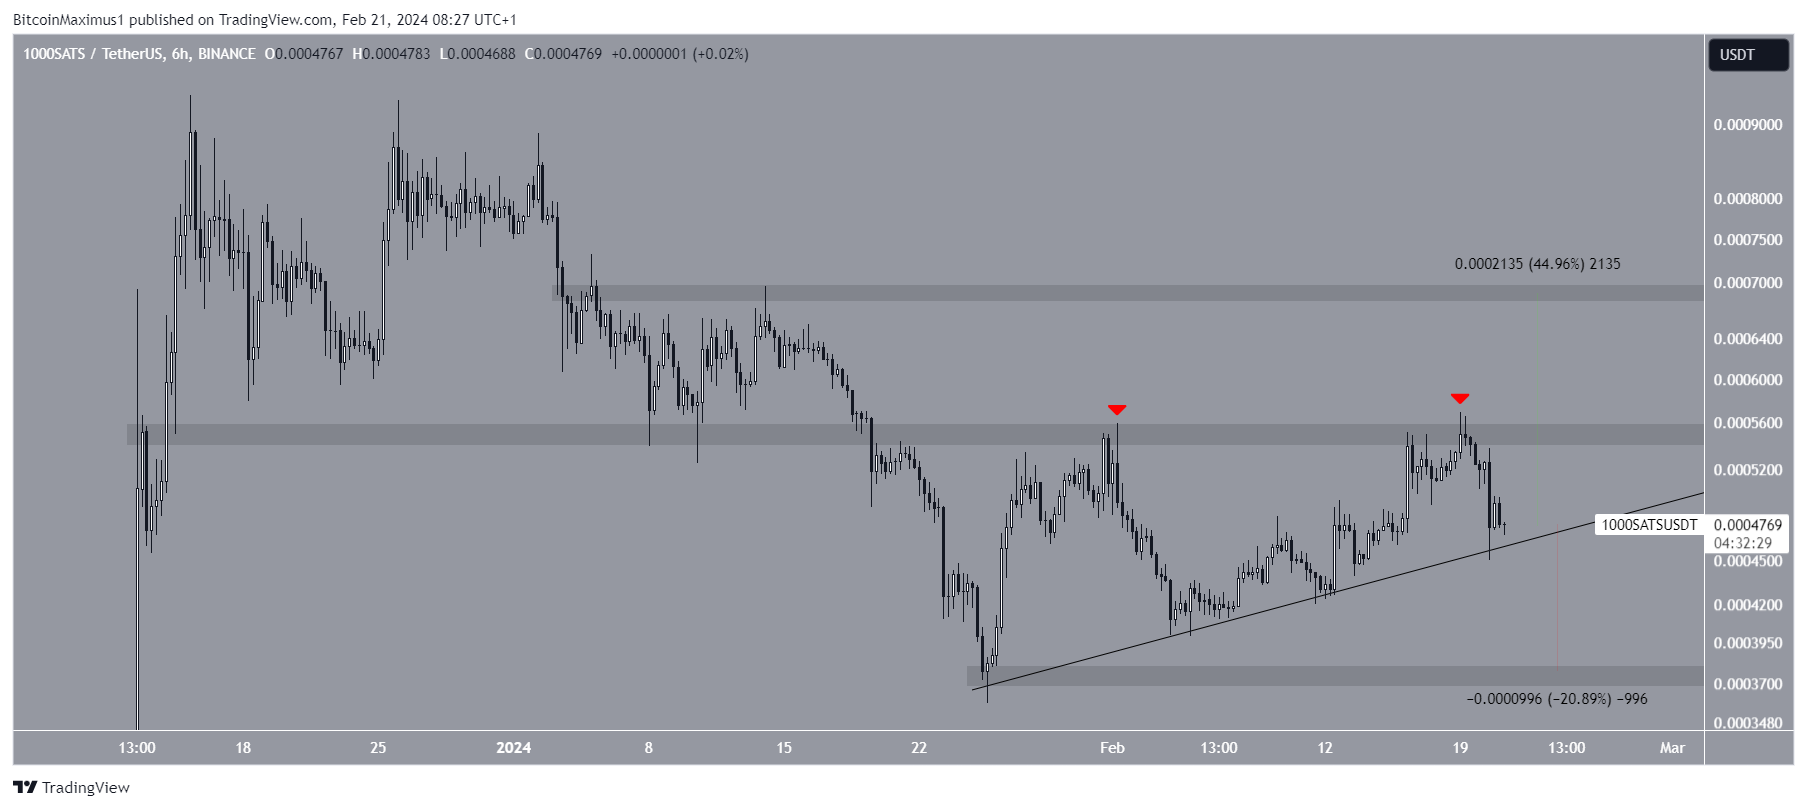
A bounce and a breakout can lead to a 45% increase to the next resistance at $0.00070, while a breakdown from the ascending support trend line can trigger a 20% drop to the next support at $0.00038.
For BeInCrypto‘s latest crypto market analysis, click here.
Disclaimer
In line with the Trust Project guidelines, this price analysis article is for informational purposes only and should not be considered financial or investment advice. BeInCrypto is committed to accurate, unbiased reporting, but market conditions are subject to change without notice. Always conduct your own research and consult with a professional before making any financial decisions. Please note that our Terms and Conditions, Privacy Policy, and Disclaimers have been updated.