Bears still have an edge on the markets as shown by the market cap which is currently at $1.97 trillion representing a drop of 0.3% from its previous 24 hours one. The trading volume has also 3.3% drop in the last 24 hours.
Golem Price Review
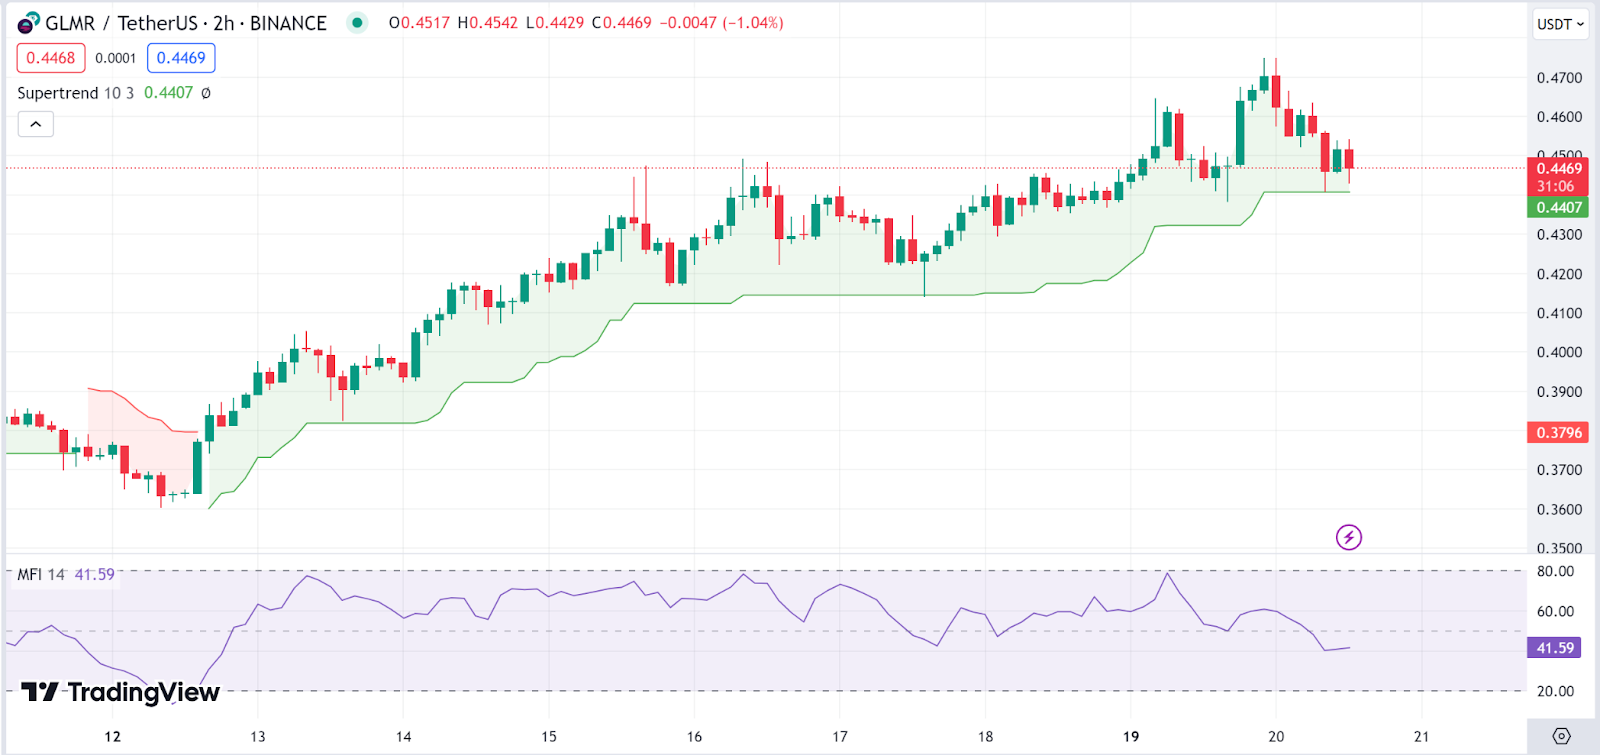
The Golem (GLM) price is currently below the Supertrend line, which suggests a bearish signal. On the other hand, the Moving Average Convergence Divergence (MACD), is not visible in this chart.
The Relative Strength Index (RSI) is around 41.59, indicating that the asset is neither overbought nor oversold. The Golem price seems to be experiencing a slight downtrend, respecting the Supertrend as resistance. The Golem price stood at $0.337 as of press time representing a 42% increase in the last 24 hours.
Alchemy Price Review
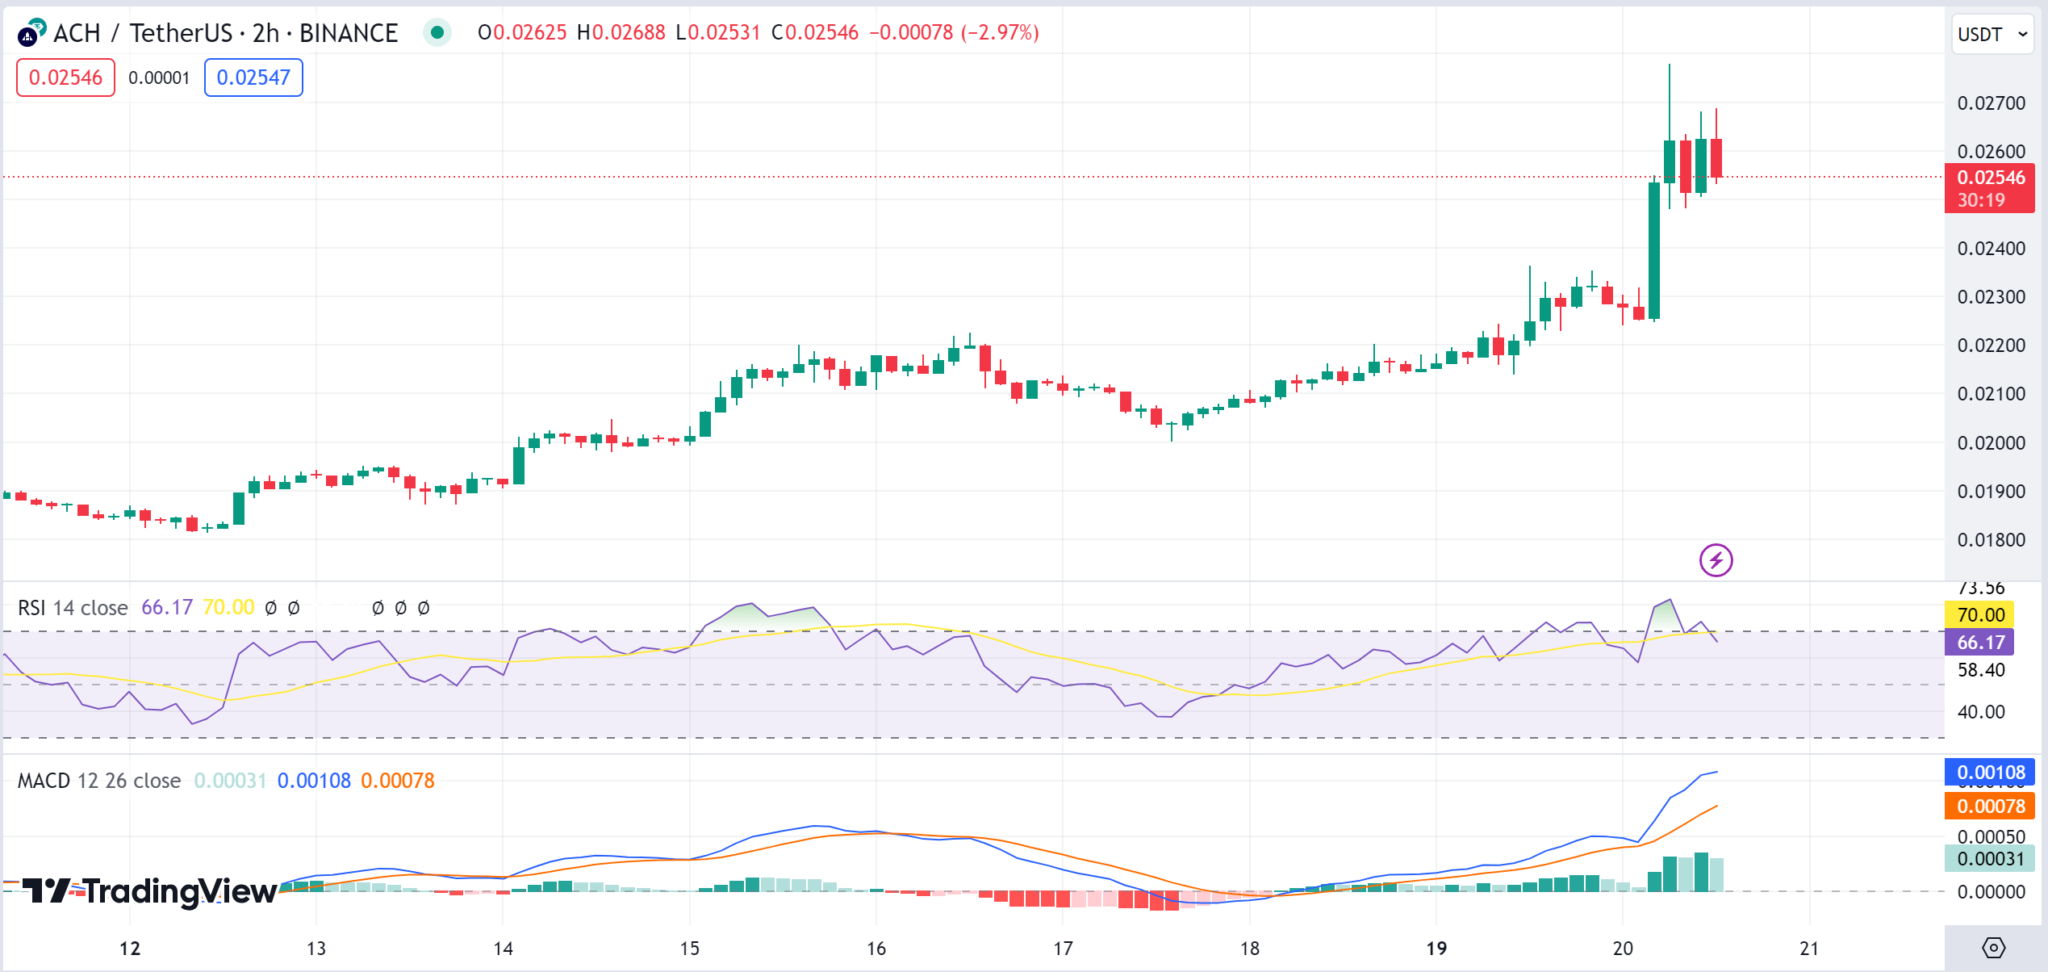
Looking at Alchemy (ACH) charts, the Relative Strength Index (RSI) is at 66.17, which is relatively high but still below the overbought threshold of 70. On the other hand, the Moving Average Convergence Divergence line is above the signal line and both are above the baseline, which is generally considered a bullish signal.
The Alchemy price has seen a significant uptick recently, although it’s currently experiencing a slight pullback. The Golem price stood at $0.337 as of press time representing a 42% increase in the last 24 hours.
IOTA Price Review
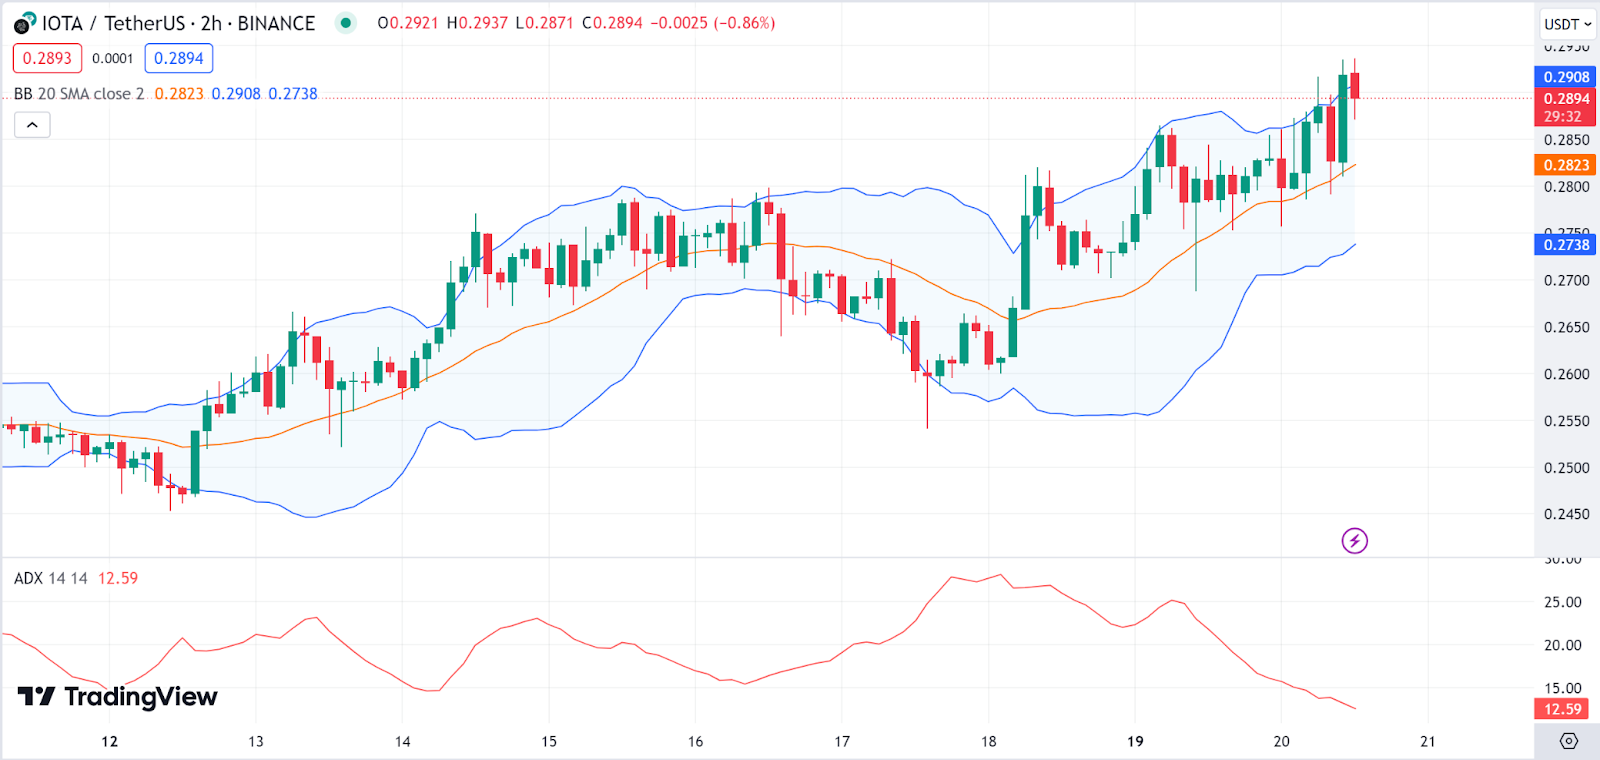
IOTA is another gainer today as the IOTA price is trading near the upper band, suggesting it might be overextended to the upside in the short term. The Average Directional Index (ADX), with a reading of 12.59, the trend strength is weak, implying that the market is not trending strongly in either direction.
The IOTA price action is choppy and mostly contained within the Bollinger Bands, indicating a lack of a strong trend. The IOTA price stood at $0.2911 as of press time representing a 4% increase in the last 24 hours.
Starknet Price Review
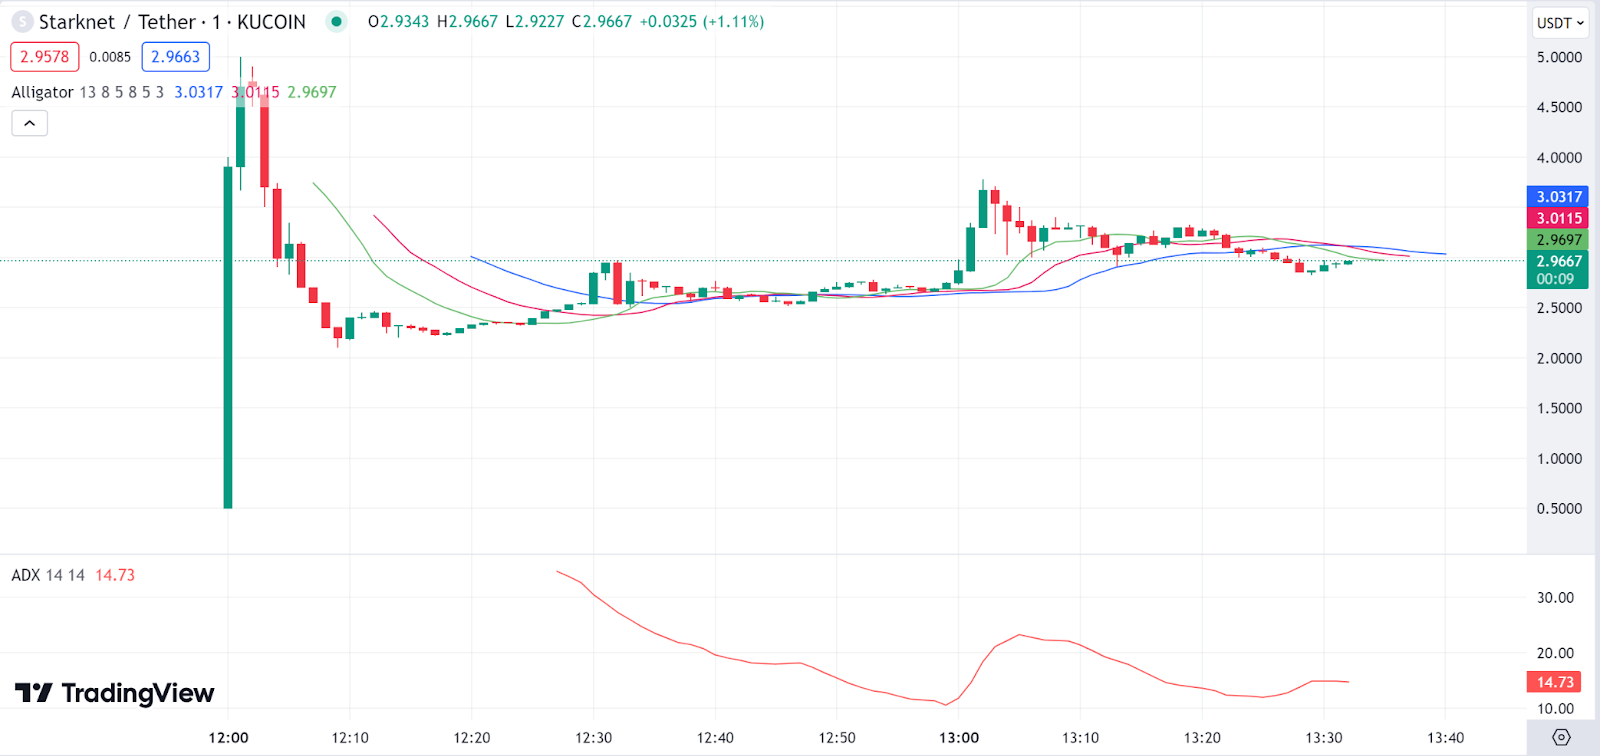
Starknet (STRK) is another gainer today as seen from the charts. The alligator lines are converging and the price is within the mouth of the alligator, suggesting a lack of direction or a consolidation phase.
Conversely, the Average Directional Index (ADX) is at 14.73, again indicating a weak trend. The Starknet price action shows a recent sharp movement followed by consolidation, which the Alligator indicator confirms. The Starknet price stood at $2.96 as of press time representing a 26% increase in the last 24 hours.
Filecoin Price Review
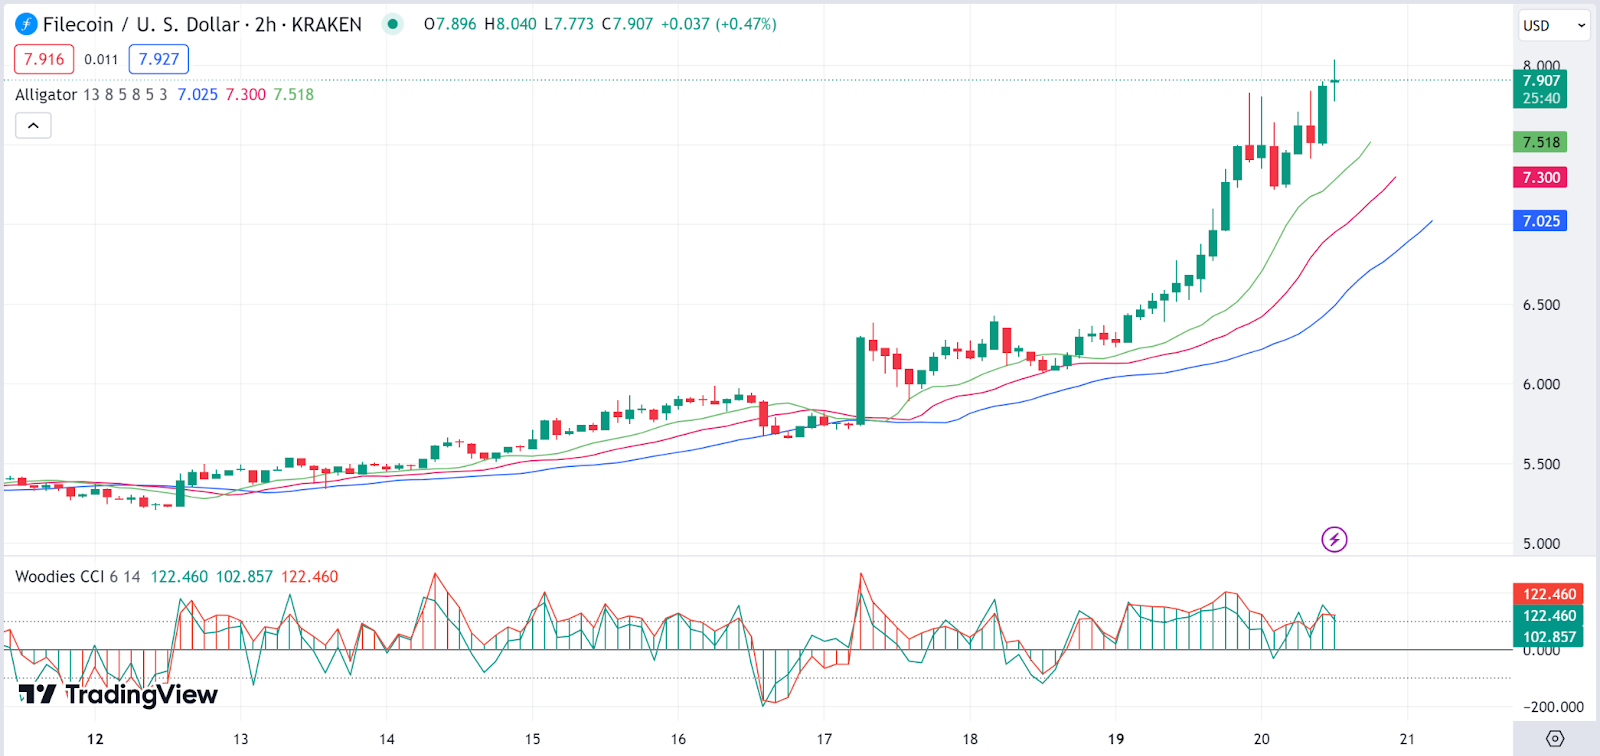
is another gainer today. The Filecoin price is above all the Alligator lines, which could be considered a bullish signal. The CCI is at 122.460, indicating that the asset is entering an overbought territory, which could signal a potential pullback or consolidation in the near term.
The Filecoin price has been in an uptrend and has recently made a significant bullish move, which is also reflected by its position relative to the Alligator indicator lines. The Filecoin price stood at $7.87 as of press time representing a 15.3% increase in the last 24 hours.
