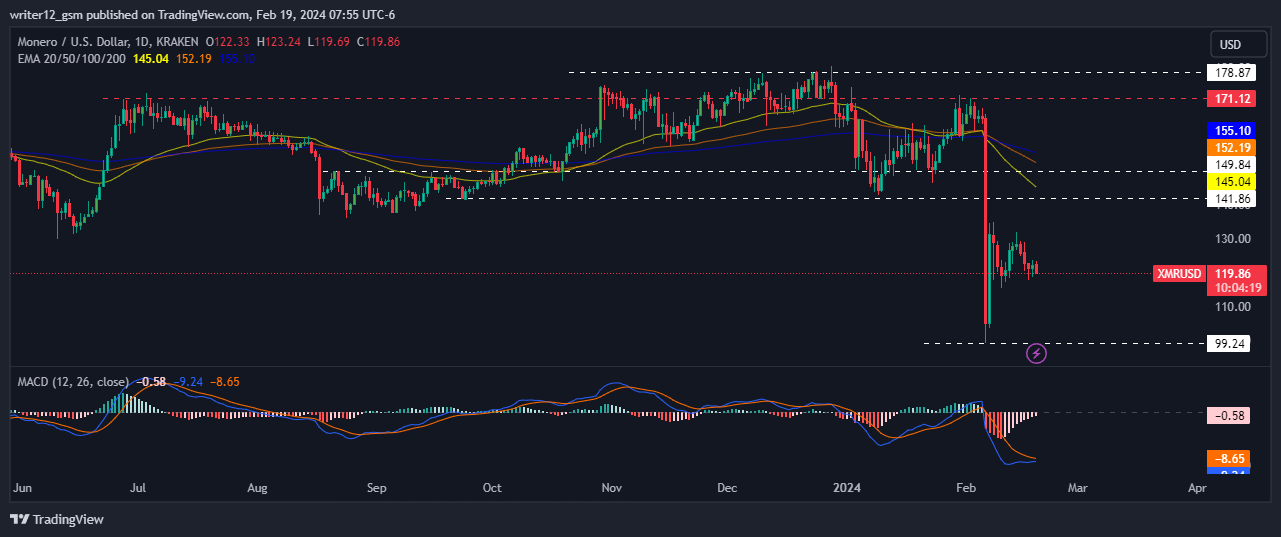
- 1 Monero crypto price is currently trading at $120.11 with a drop of 1.76% in the last 24 hours with a market cap of $66.58 Million.
- 2 Monero crypto prices decreased by 24.10% over the last 30 days.
Monero crypto (MONERO) is trading below the key moving average showcasing the bearishness on the daily technical chart. However, the buyers are still accumulating the crypto at the lower levels.
Over the week, Monero crypto has witnessed a decrease of approximately 0.46%, and this decline has been steeper over a month, reaching around 24.10%. Looking back over three months, XMR cryptos have dropped by about 26.40%, while the decline extends to around 17.46% over the last six months. Furthermore, the crypto’s performance throughout the year has been lackluster, with a year-to-date slump of approximately 27.10%.
At press time, the Monero crypto price was $119.86, with an intraday loss of 1.96%, showing bearishness on the technical charts. Moreover, the trading volume is 66.58 Million. The market cap is $2.21 Billion.
Moreover, if selling volume adds up then the price might conquer supporting SMAs by making lower highs and lows. Hence, the XMR price is expected to move downwards giving bearish views over the daily time frame chart.
Technical Analysis of Monero Crypto Price in 1-D Timeframe

Monero (USD: XMR) has seen its crypto price decline throughout the year. At the time of writing, XMR crypto is trading at lower trendline support and has been trying to take a pullback.
If it can keep this level, the Moneroprice could continue to go up and reach the first and second targets of $141 and $150. However, if the XMR price cannot maintain this level and falls, then it might hit the closest support levels of $100 and $90.
At the time of publishing, Monero crypto (USD: XMR) is trading below the 50 and 200-Day SMAs (Simple moving averages), which are supporting the price trend. The MACD line at -9.29 and the signal line at -8.66 are above the zero line. A bearish crossover is observed in the MACD indicator which signals more bearishness for the XMR crypto price.
The current value of RSI is 36.41 points. The 14 SMA is above the median line at 36.76 points, indicating that the Monero crypto is bearish.
Summary
Monero (USD: XMR) technical indicators are showing a bearish trend. The MACD, RSI, and EMA are all suggesting negative indications, which means that the downward trend of XMR crypto price may continue. However, if buyers begin supporting Monero, its price could rise. For Monero to enter the recovery phase, it needs to attract more buyers to push its crypto price up. Currently, the price of Monero crypto is stuck below the key moving averages..
Technical Levels
Support Levels: $100.00 and $90.00
Resistance Levels: $141.00 and $150.00
Disclaimer
This article is for informational purposes only and does not provide any financial, investment, or other advice. The author or any people mentioned in this article are not responsible for any financial loss that may occur from investing in or trading. Please do your own research before making any financial decisions.
Nancy J. Allen is a crypto enthusiast, with a major in macroeconomics and minor in business statistics. She believes that cryptocurrencies inspire people to be their own banks, and step aside from traditional monetary exchange systems. She is also intrigued by blockchain technology and its functioning. She frequently researches, and posts content on the top altcoins, their theoretical working principles and technical price predictions.
 thecoinrepublic.com
