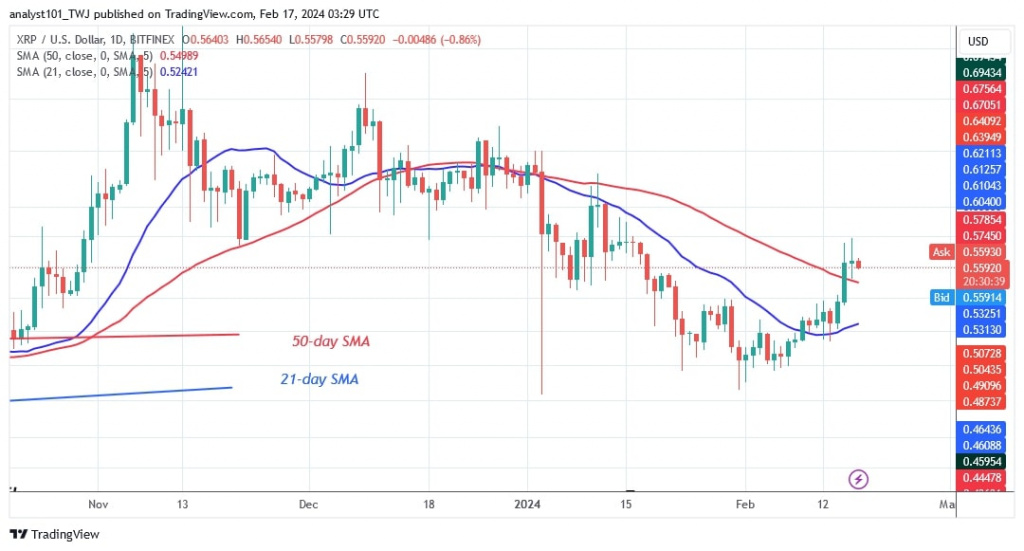
The price of Ripple (XRP) has regained positive momentum, breaking above the 50-day SMA and reaching a high of $0.57.
Long-term outlook for the Ripple coin price: bullish
The cryptocurrency was previously trapped between the moving average lines for a week. Currently, the bullish momentum has hit an early blockage at the $0.58 resistance level.
Ripple is on the retreat after two rejections at the resistance. The rally will resume if XRP clears the initial barrier and resistance at $0.62. The market will rise to highs of $0.67 and $0.73.
The altcoin is bearish near the moving average lines. The current positive momentum will continue if the altcoin stays above the moving average lines. However, if the bear breaks below the moving average lines, XRP will fall and return to its previous low above $0.50.
XRP indicator analysis
The price bars have risen above the moving average lines after being trapped between them. The altcoin will continue to rise if the price bars remain above the moving average lines. The moving average lines on the daily chart have remained southward despite the price rise.
Technical indicators:
Key resistance levels – $0.80 and $1.00
Key support levels – $0.40 and $0.20

What is XRP's next move?
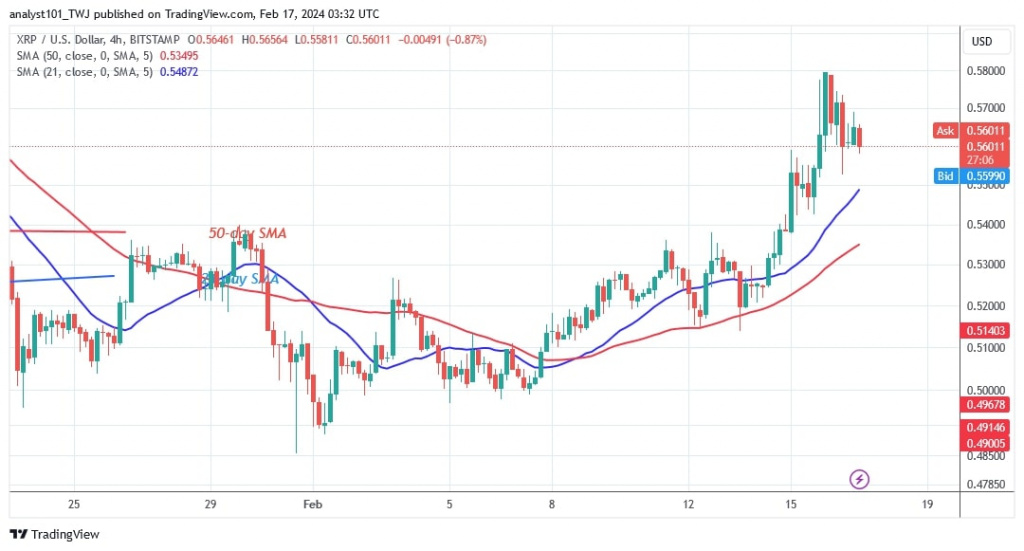
On the 4-hour chart, XRP has resumed its uptrend after the price rally. The positive momentum remains at the high of $0.58. The price has now retraced and found support above the moving averages again. XRP is likely to return to its previous highs.

In previous price action, XRP has fallen above the $0.50 support but below the moving average lines, as reported by Coinidol.com on February 11, 2024.
Disclaimer. This analysis and forecast are the personal opinions of the author and are not a recommendation to buy or sell cryptocurrency and should not be viewed as an endorsement by CoinIdol.com. Readers should do their research before investing in funds.
 coinidol.com
