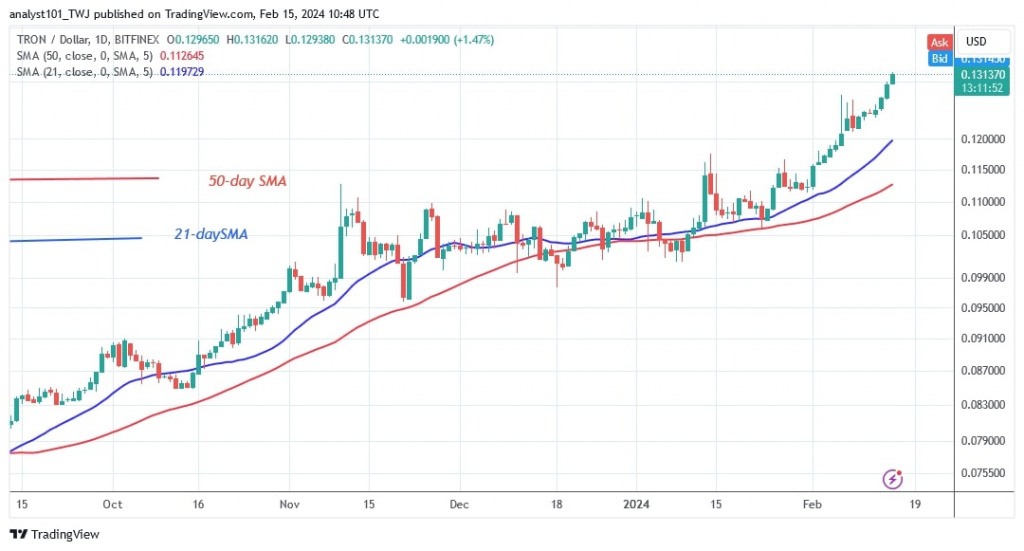
The price of TRON (TRX) has repeatedly risen above the moving average lines in recent months. TRX price analysis by Coinidol.com.
Long-term forecast for the TRON price: bullish
The bullish momentum was reinforced when the bulls broke through the overhead resistance at $0.115 and then the subsequent hurdle at $0.126. The altcoin peaked at $0.132 after breaking through the barrier at $0.126. TRON is currently worth $0.131. The cryptocurrency is struggling to break through the current resistance at $0.132. If the market breaks through the current resistance, it will reach a high of $0.15.
TRON indicator reading
TRON has continued to make new highs with the price rising above the moving average lines. The moving average lines have continuously moved north without slipping down. The moving average lines show a strong upward trend. The upward trend will continue if the price bars remain above the moving average lines.
Technical indicators
Important supply zones: $0.09, $0.10, $0.11
Important demand zones: $0.06, $0.05, $0.04

What is the next direction for TRON?
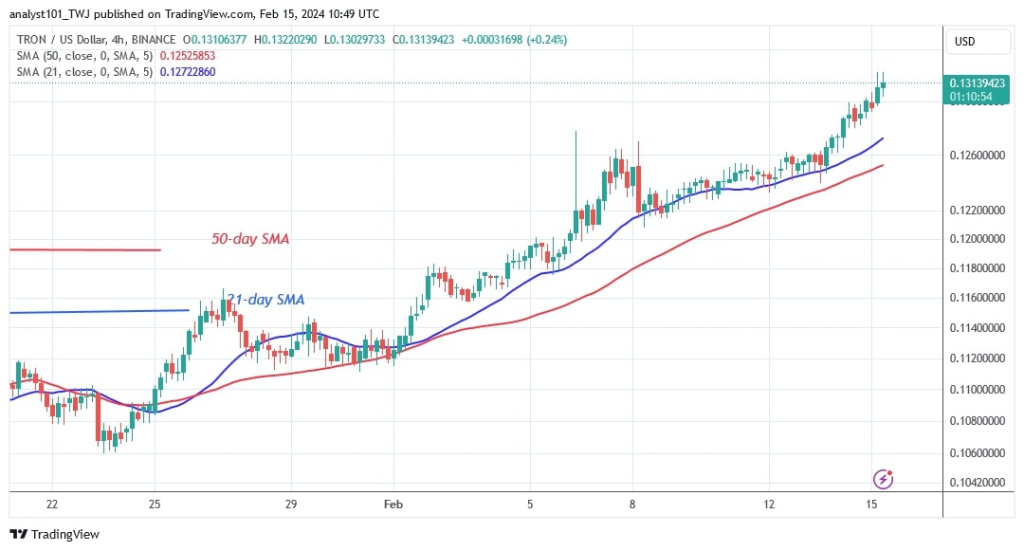
On the 4-hour chart, TRON briefly paused at the $0.132 resistance level. The price of the cryptocurrency is currently oscillating below its recent high. Long candlestick wicks indicate significant selling pressure as prices rise. TRON is dropping towards the moving average lines. If it finds support above this level, the uptrend will resume.

Disclaimer. This analysis and forecast are the personal opinions of the author and are not a recommendation to buy or sell cryptocurrency and should not be viewed as an endorsement by CoinIdol.com. Readers should do their research before investing in funds.
 coinidol.com