
- 1 The HNT token breached the neckline above $10 and registered a breakout.
- 2 Buyers have gained momentum and are dominating the HNT price trend.
Helium (HNT) token glimpsed a sharp buying momentum and decisively topped the crucial hurdle of $10. A rounding bottom formation, whose neckline was breached, and a much-awaited breakout was glanced on the charts. Similarly, a bullish crossover was noted, which signifies that the breakout is loyal, and a further up move toward $12 can be foreseen soon.
HNT token price is trading beyond the key moving averages and is offering an uptrend for the past sessions. Moreover, the price action represents a rebound from the 50-day EMA mark and conveys the buying momentum. On the other hand, sellers looked trapped and aggressively covered their positions, which led to an up move in the recent sessions.
The Helium token (HNT) price was $10.40 at press time, with a massive intraday gain of 13.22%, showing bullishness on the charts. Moreover, the trading volume increased by 67.13% to $20.27 Million, highlighting the pullback. The pair of HNT/BTC is at 0.000199 BTC, and the market cap is $1.02 Billion. Analysts are bullish and suggest that the HNT price will continue to extend gains and may reach $12 soon.
HNT Price on Daily Charts Displays Rounding Bottom Pattern Breakout
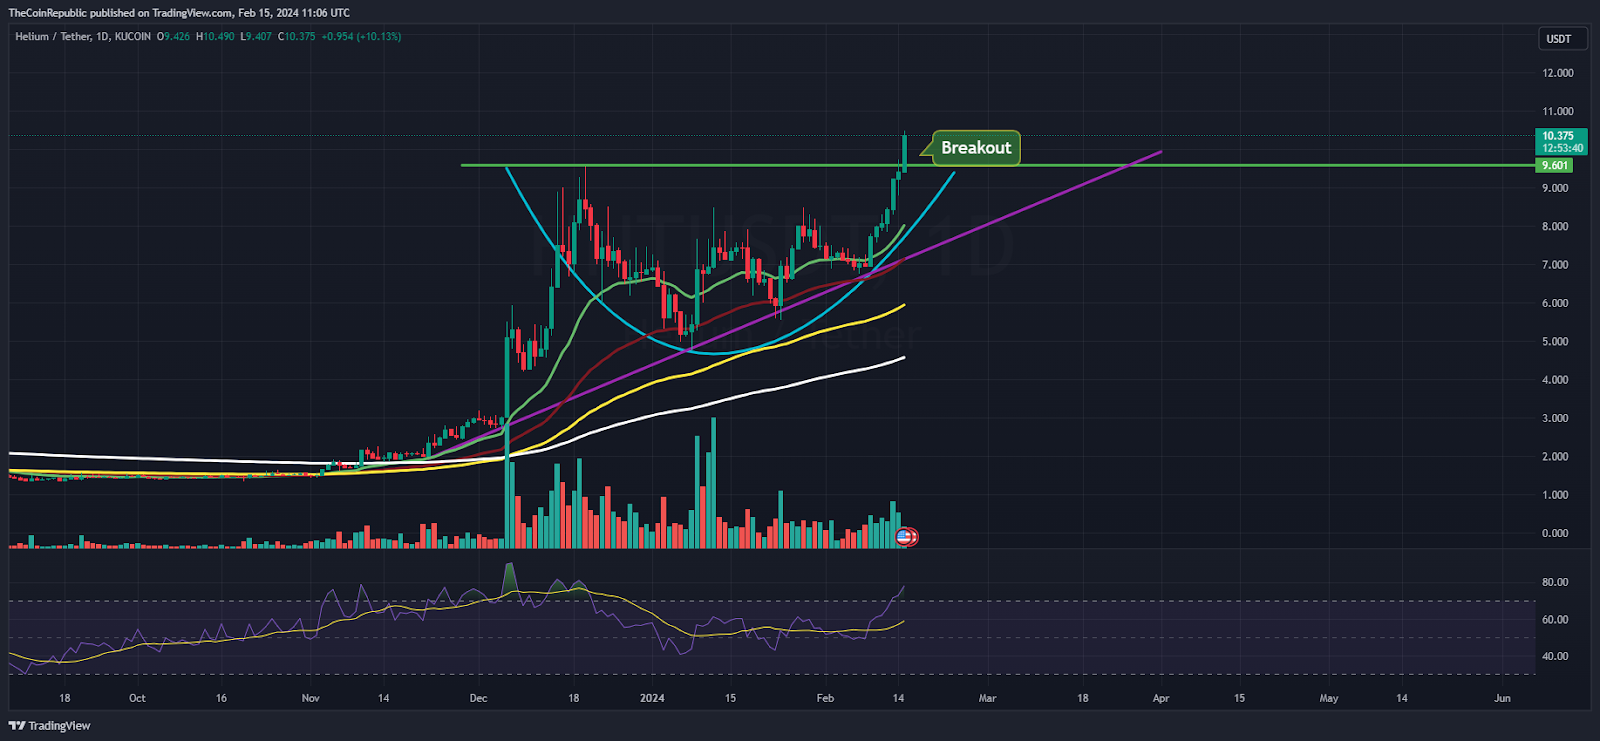
The Helium price denoted an enthusiastic buying momentum on the daily charts and caught a ripple of over 80% from the start of 2024 till now. Moreover, the buyers have acquired stability and persisted in accumulating the gains, which shifted to carry forward the bull rally. The token price has assembled fresh higher high swings. It replicates the three white soldiers pattern, displaying investor interest.
The Relative Strength Index (RSI) curve climbed to the overbought zone and noted a positive crossover on the charts. Moreover, the Moving Average Convergence Divergence (MACD) indicator shows a bullish crossover and suggests an outperformance outlook for the upcoming sessions.
Per the Fib levels, the token has transcended the 61.8% zone and is heading toward the 78.6% zone.
HNT On Weekly Charts Reveals Sharp Recovery From Lows
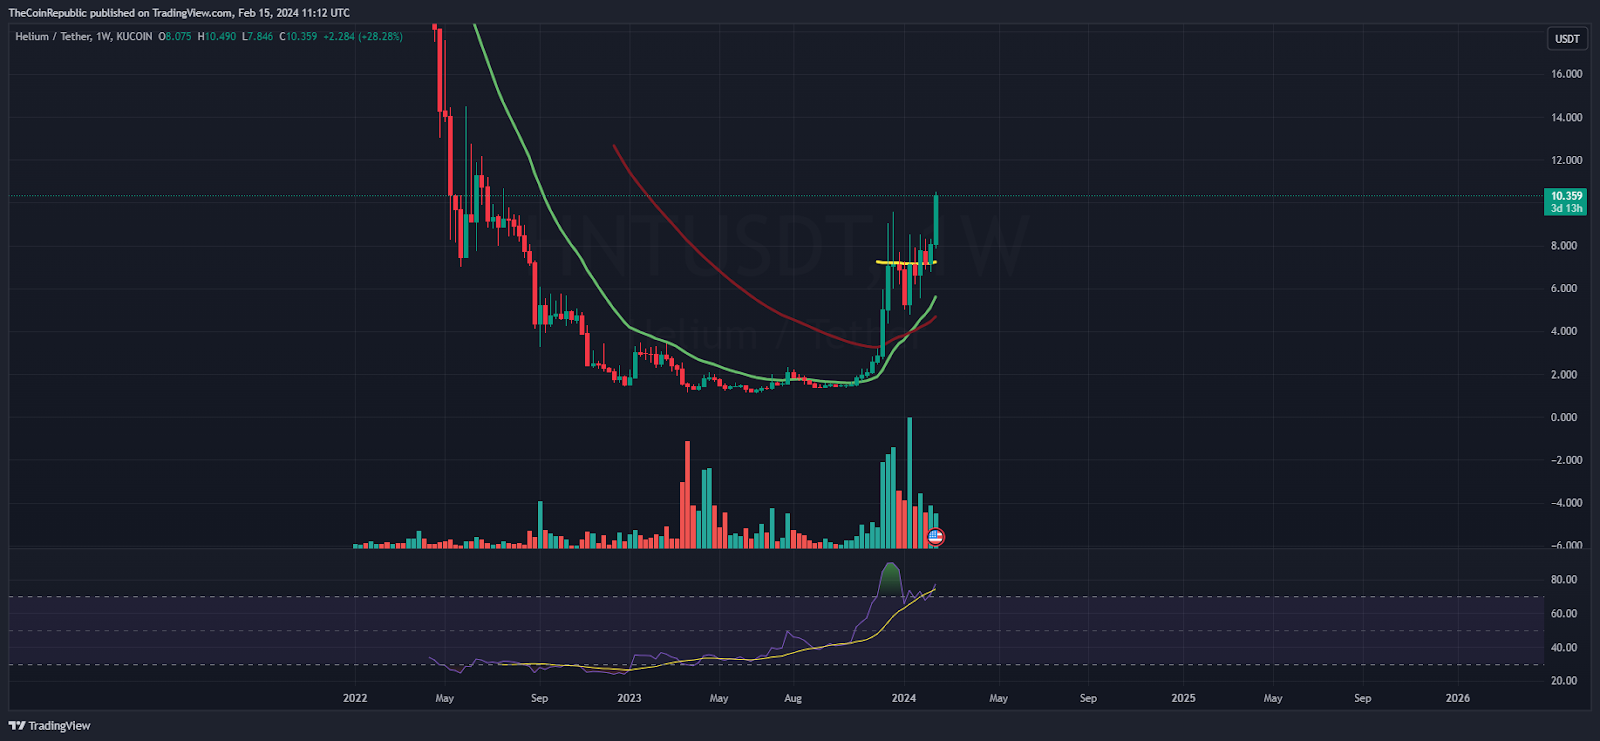
On the weekly charts, Helium token cited a massive comeback from the bottom zone of $1.80, streaming over 350% in the past months. The price action indicates a bullish marubozu candlestick, which transited the last two months’ highs and the buyers prospered. The token price has mounted above the 100-day EMA mark, which signals a massive strength. It can stretch the up move in the following sessions.
Summary
Helium price illustrates a follow-on buying momentum and decisively exceeded the neckline of $10, the make-or-break zone. If the token price sustains above that, the bulls can lift it toward $12 and then $14 in the upcoming sessions.
Technical Levels
Support Levels: $9.80 and $9
Resistance Levels:$11 and $11.70
Disclaimer
The views and opinions stated by the author or any other person named in this article are for informational purposes only and do not constitute financial, investment, or other advice. Investing in or trading crypto or stocks comes with a risk of financial loss.
With a background in journalism, Ritika Sharma has worked with many reputed media firms focusing on general news such as politics and crime. She joined The Coin Republic as a reporter for crypto, and found a great passion for cryptocurrency, Web3, NFTs and other digital assets. She spends a lot of time researching and delving deeper into these concepts around the clock, and is a strong advocate for women in STEM.