- 1 The FTM token price witnessed a pullback from the support zone of $0.300.
- 2 The FTM price has retested the 200 day EMA mark and is looking to retain $0.500.
FTM, the native token of the Fantom Network, witnessed a rebound from the 200-day EMA zone and is ready to lift gains toward its supply region of $0.500. Moreover, the price action signifies the buyers’ accumulation near the demand zone and sellers have covered their positions. Furthermore, the token has absorbed the selloff and is ready to climb above the prompt hurdle of $0.4000.
The token trades above the key moving averages and replicates a slightly bullish stance on the charts. Furthermore, the technicals suggest that the Fantom token price may gain momentum and convey buying action in the upcoming sessions. The token has sustained gains above neutrality and is waiting to skyrocket the gains soon. If the token succeeds in holding the immediate support zone of $0.3000, the bears may face anxiety, leading to a bounce in the short term.
The FTM token (Fantom) price was $0.3818 at press time, with an intraday drop of 4.19%, showing neutrality on the charts. Moreover, the trading volume increased by 3.81% to $45.60 Million, highlighting the buying momentum. The pair of FTM/BTC is at 0.00000793 BTC, and the market cap is $667.68 Million. Analysts are bullish and suggest that the Fantom (FTM) crypto price will retain strength and may lift the gains above $0.5000 soon.
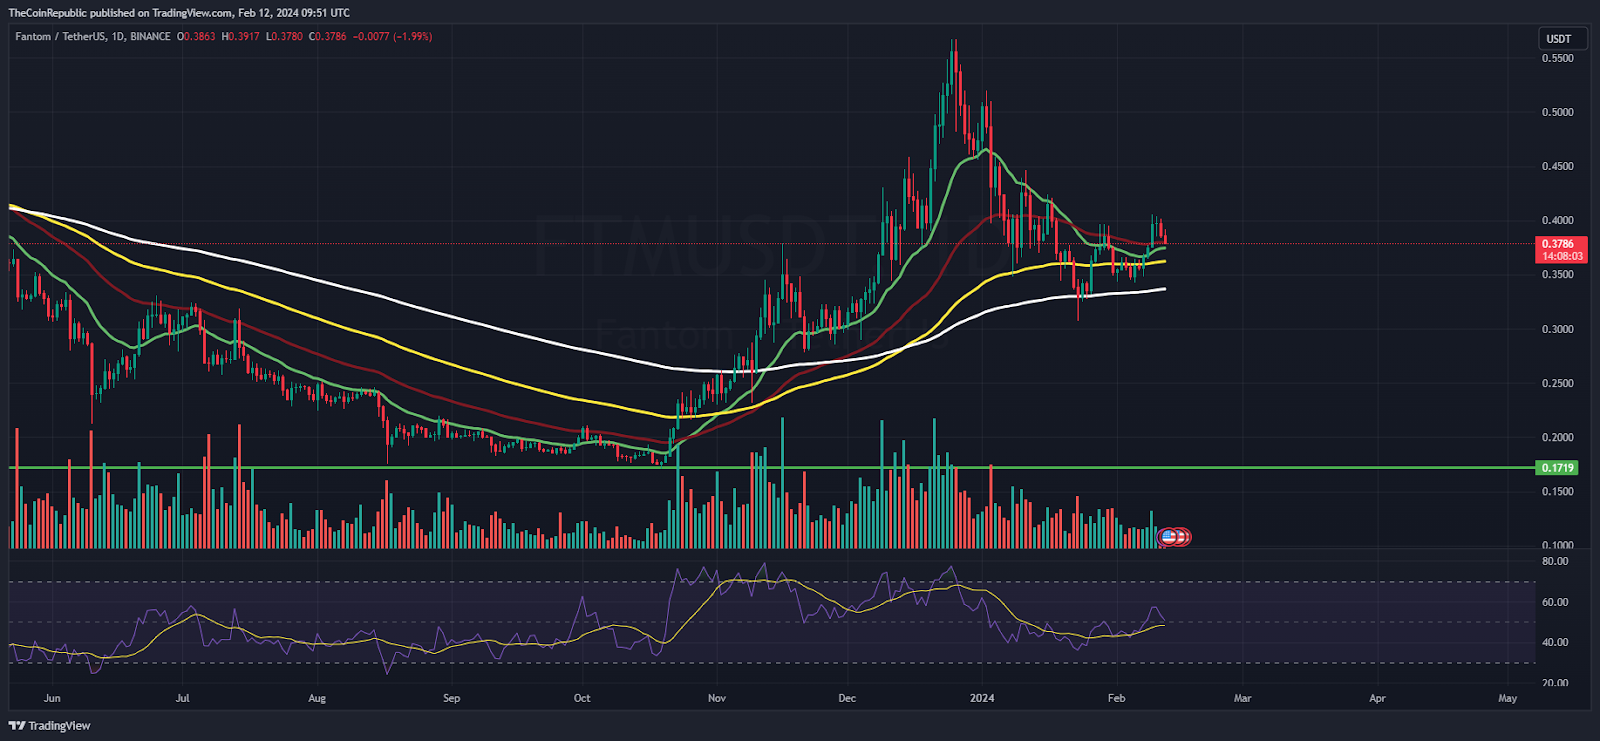
FTM on Daily Charts Exhibits Buyers Accumulation

On the daily charts, the FTM price experienced a retracement from the highs of $0.550 and corrected over 30% in the last sessions. Moreover, the sellers are still trying to push the token below its critical support zone of $0.2500, but have not succeeded. A pullback was noted, which led to sellers being trapped. However, the token must sustain above the 20-day EMA mark to stretch the rebound. Otherwise, it will lead to a decline in the following sessions.
The Relative Strength Index (RSI) curve stays close to the midline and shows a positive divergence, which may lead to an up move in the following sessions. Moreover, the MACD indicator shows a bearish crossover and still displays the bearishness on the charts. However, the token trades above the 38.2% Fib level and may retest the 50% zone above $0.4600 in the following sessions.
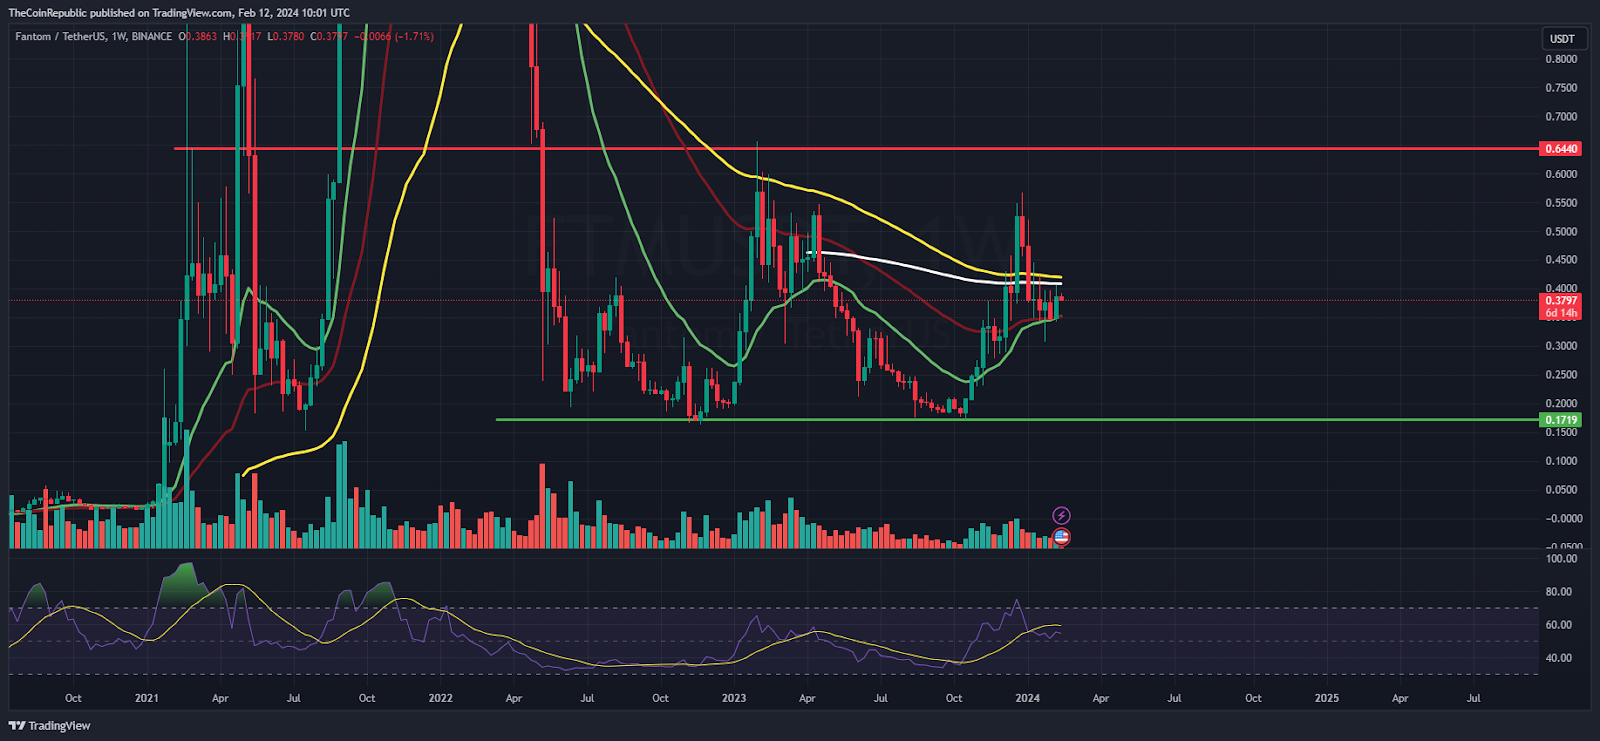
FTM on Weekly Charts Exhibits Double Bottom Formation

On the weekly charts, Fantom token has formed its base structure and marked a double bottom formation near the demand zone of $0.2000. Afterward, the token witnessed a slow & steady recovery and reached the 100-day EMA zone. However, failed to surpass the crucial hurdle of $0.5000 and faced difficulty to escape.
Summary
The Fantom (FTM) token price depicted a neutral outlook and witnessed a recovery from the 200-day EMA mark. Moreover, the token is poised to reach the upside toward $0.5000 and may attain bullishness soon.
Technical Levels
Support Levels: $0.3000 and $0.2700
Resistance Levels:$0.4000 and $0.4400
Disclaimer
The views and opinions stated by the author or any other person named in this article are for informational purposes only and do not constitute financial, investment, or other advice. Investing in or trading crypto or stocks comes with a risk of financial loss.
Steefan George is a crypto and blockchain enthusiast, with a remarkable grasp on market and technology. Having a graduate degree in computer science and an MBA in BFSI, he is an excellent technology writer at The Coin Republic. He is passionate about getting a billion of the human population onto Web3. His principle is to write like “explaining to a 6-year old”, so that a layman can learn the potential of, and get benefitted from this revolutionary technology.
 thecoinrepublic.com
