- 1 Graph price forecast suggests a bounce-back in the price.
- 2 $GRT price is breaking above the key moving averages, showcasing bullishness.
- 3 Crypto surged by almost 9.34% this week, demonstrating a comeback by the buyers.
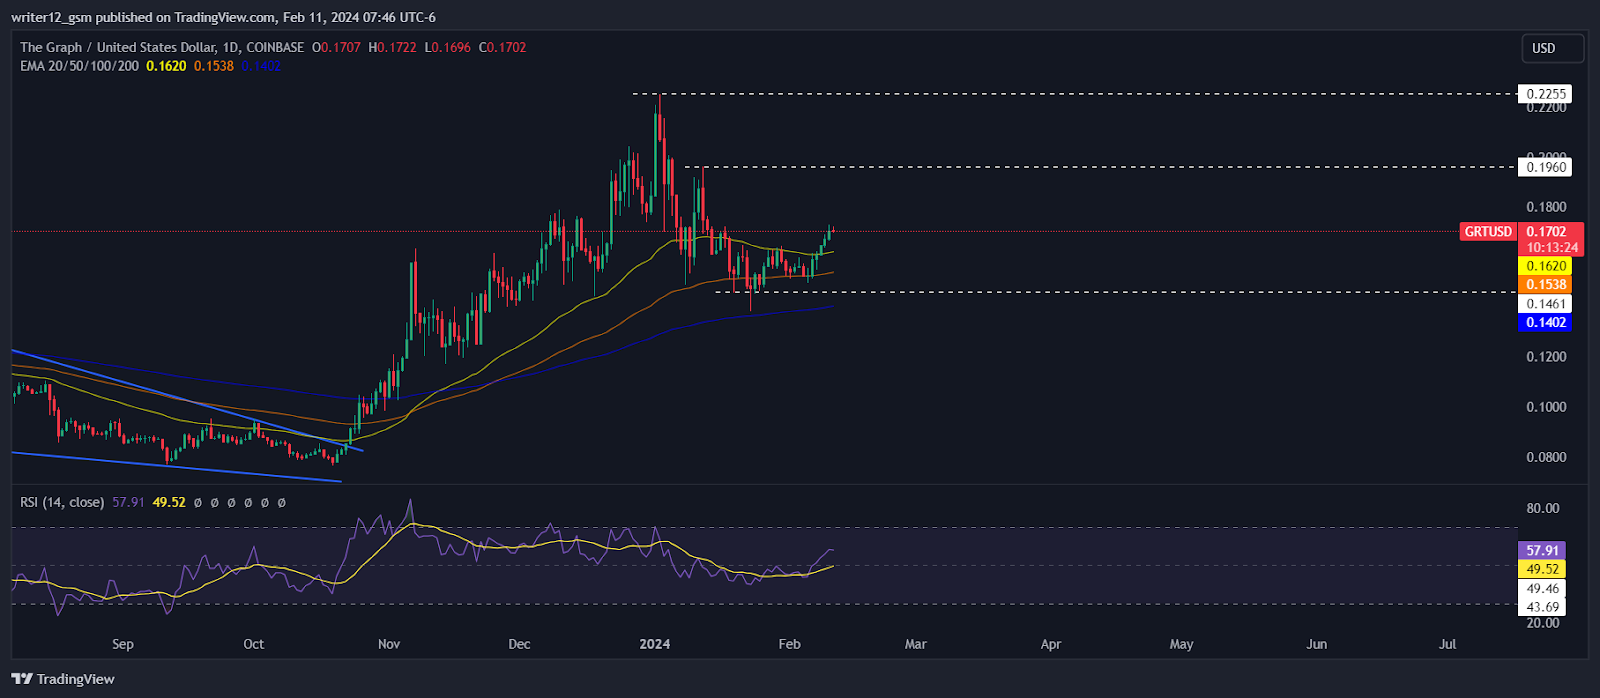
Graph price prediction showcases the increase of $GRT crypto value towards the supply zone over the daily time frame chart. Moreover, sellers are currently trying to pull the $GRT price below the demand zone but failing in their attempts.
However, bulls came forward to the rescue of $GRT cryptocurrency from the lower trendline. $GRT crypto price has been falling from the price range of $0.2255.
$GRT price must accumulate more buyers to surpass the demand zone. However, volume is also supporting the price as it increased in the previous sessions. Investors in Graph cryptocurrency need to wait for a retest of the price for further entry on the daily time frame chart.
Graph price was at $0.1698 and has lost 0.47% of its market capitalization during the day’s trading session and the intraday trading volume is 41.02 Million. This demonstrates that buyers are trying to accumulate for the rescue of $GRT crypto. The volume-to-market cap ratio was at 0.0262%.
Graph price has experienced an 8.64% increase over the past week and a 9.44% decline in the last month. Furthermore, $GRT cryptocurrency has seen a 25.59% rise in the past three months and a 56.07% increase in the past six months. Year to date, $GRT has declined by approximately 8.02%.
Graph Price Technical Analysis on Daily Time Frame
 $GRT Crypto Price Bouncing Back?">
Graph price prediction suggests $GRT could rise above the supply zone. $GRT crypto has jumped above the 20, 50, 100, and 200-Day daily moving averages.
Technical indicators suggest the positive outlook of Graph cryptocurrency. The relative strength index confirms that $GRT crypto is bullish. Moving average convergence divergence also confirms the rise of $GRT.
RSI was at 56.70 and is about to enter the oversold zone. The MACD line is crossing the signal line, registering a positive crossover. Investors in Graph cryptocurrency need to wait for any directional change over the daily time frame chart.
Summary
Graph price prediction showcases the incline of $GRT crypto towards the supply zone over the daily time frame chart. $GRT crypto must accumulate buyers to reach the upper level of the supply zone. Graph crypto has experienced an 8.64% increase over the past week and a 9.44% decline in the last month. Technical indicators suggest the positive state of Graph cryptocurrency. Investors in Graph cryptocurrency need to wait for the retest of the price before any further entry.
Technical Levels
Support Level: $0.2255.
Resistance Level: $0.1538.
This article is for informational purposes only and provides no financial, investment, or other advice. The author or any people mentioned in this article are not responsible for any financial loss that may occur from investing in or trading. Please do your research before making any financial decisions.
Andrew is a blockchain developer who developed his interest in cryptocurrencies while pursuing his post-graduation major in blockchain development. He is a keen observer of details and shares his passion for writing, along with coding. His backend knowledge about blockchain helps him give a unique perspective to his writing skills, and a reliable craft at explaining the concepts such as blockchain programming, languages and token minting. He also frequently shares technical details and performance indicators of ICOs and IDOs.