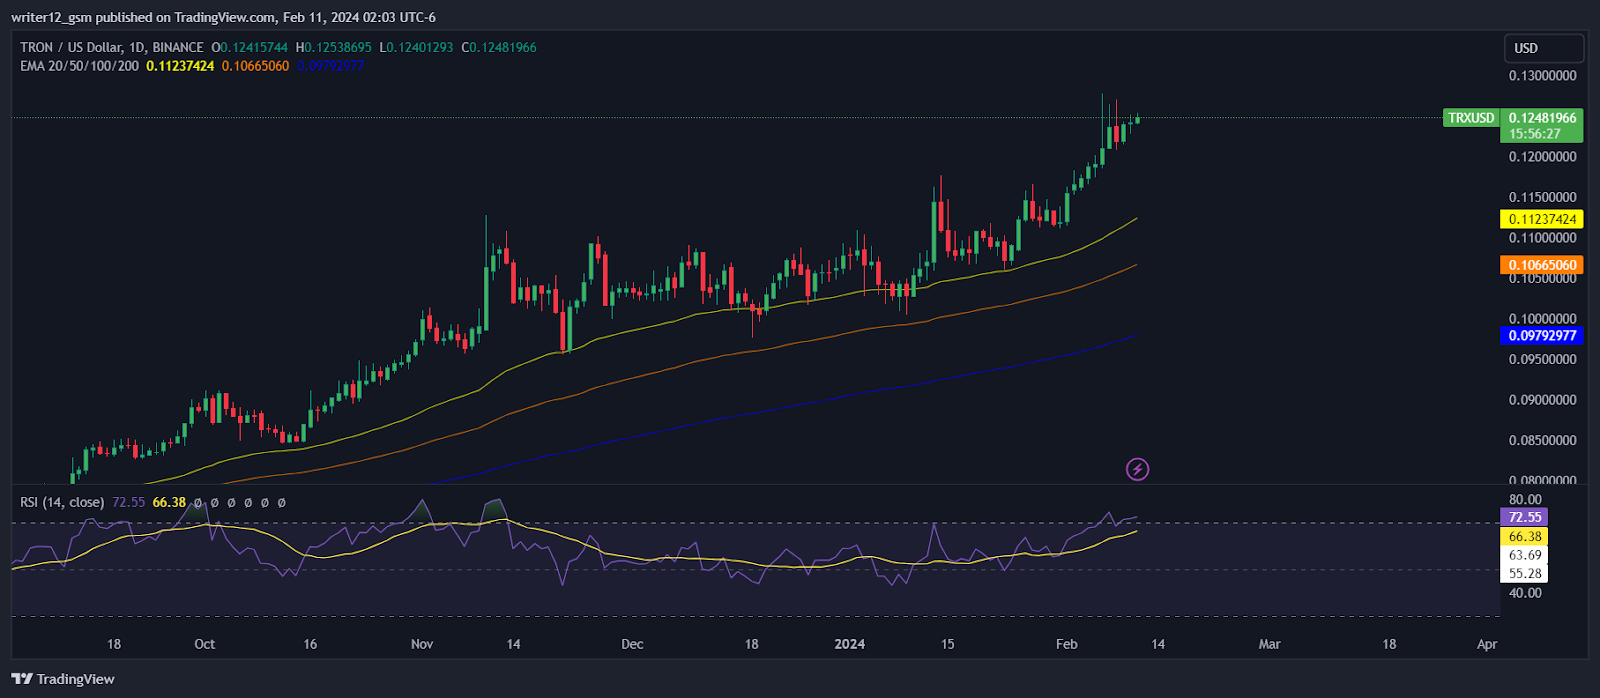
- 1 TRON price is trading with a bullish momentum on the daily time frame.
- 2 TRX price surged by almost 6.11% this week indicating the strong buyer presence.
- 3 Buyers looked aggressive in the previous sessions as they dominated sellers by making long positions.
TRON crypto price is trading in the bullish territory and close to the upper trendline near $0.130000000 which, if surpassed, would lead to a massive rally. Moreover, the price action showcased an uptrend, favoring the bulls, and suggesting follow-on buying action in the upcoming sessions. Furthermore, the price trades above the key Fib level and shows bullishness.
TRON crypto has shown resilience in favor of the bulls, recovering gains decisively and reclaiming a bullish stance. Over the past weeks, TRON crypto has demonstrated consistent upward movement, reflecting strong demand and accumulation.
TRON price shows the bulls’ dominance and suggests a further bull rally toward the trajectory swing of $0.130000000. Moreover, the crypto trades above the significant moving averages and shows bullish momentum.
Throughout the year, the TRON price displayed bullishness, indicating the potential for reaching new highs amidst shifting market dynamics. TRX experienced a modest increase of 5.98% in the past week, which continued with a noteworthy increase of 16.77% over the past month. Furthermore, its value witnessed a significant incline of approximately 14.52% in the last three months and a sharp surge of 60.80% in the preceding six months. TRX cryptocurrency has risen by 15.35% year to date.
Analyzing TRON Price Technical Indications

TRON price analysis suggests the possibility of reaching new highs, potentially leading to a significant upturn on the daily time frame chart. However, it’s important to note that the price is already in the overbought zone. Simultaneously, cryptocurrency is working to maintain its position above the 50-Day exponential moving average (EMA) as it aims to surpass the upper levels.
Technical indicators for TRX cryptocurrency raise suggest bullishness. The relative strength index (RSI) shows an upward trend in TRX value, while the moving average convergence divergence (MACD) also suggests a positive momentum.
Currently, the RSI is at 72 and is making efforts to maintain a bullish position. Additionally, the MACD line is above the signal line, indicating a favorable outlook. Investors involved in TRON cryptocurrency should remain patient and monitor the daily time frame chart for any potential changes in direction.
Summary
The TRX price analysis indicates that cryptocurrency is currently heading upward by making a higher-high structure. EMAs and other indicators are supporting the price. However, it’s important to note that the price is already in the overbought zone.
Technical Levels
Support Levels: The TRON Crypto price may find support at $0.13000000 and $0.13500000, where it could bounce back or stabilize.
Resistance levels: The TRX Crypto price may face resistance at $0.11235808 and $0.10664244, where it could reverse or consolidate.
Disclaimer
This article is for informational purposes only and provides no financial, investment, or other advice. The author or any people mentioned in this article are not responsible for any financial loss that may occur from investing in or trading. Please do your research before making any financial decisions.
Steve Anderson is an Australian crypto enthusiast. He is a specialist in management and trading for over 5 years. Steve has worked as a crypto trader, he loves learning about decentralisation, understanding the true potential of the blockchain.
 thecoinrepublic.com