
Despite the absence of significant excitement following the introduction of spot Bitcoin exchange-traded funds (ETFs), investors continue to eagerly invest in certain ETFs. Eric Balchunas, a senior ETF analyst at Bloomberg, notes that BlackRock’s iShares Bitcoin Trust ETF has surged into the top 5 ETFs in terms of inflows since the beginning of the year.
In the crypto market’s last 24-hour cycle, a significant rebound has been observed, resulting in over $125 million in total liquidations. The
has notably undermined the confidence of sellers after a period of trading within a bearish zone, as it recently surpassed the $46,500 mark.
This shift has injected a wave of bullishness into the market. Our analysis will dive into the current performance of trending cryptocurrencies and examine their trading patterns.
Bitcoin ($BTC) Price Analysis
Bitcoin’s price movements were confined to a narrow range around $43,800. However, the recent breakout above the resistance channel pushed the price toward $47K.
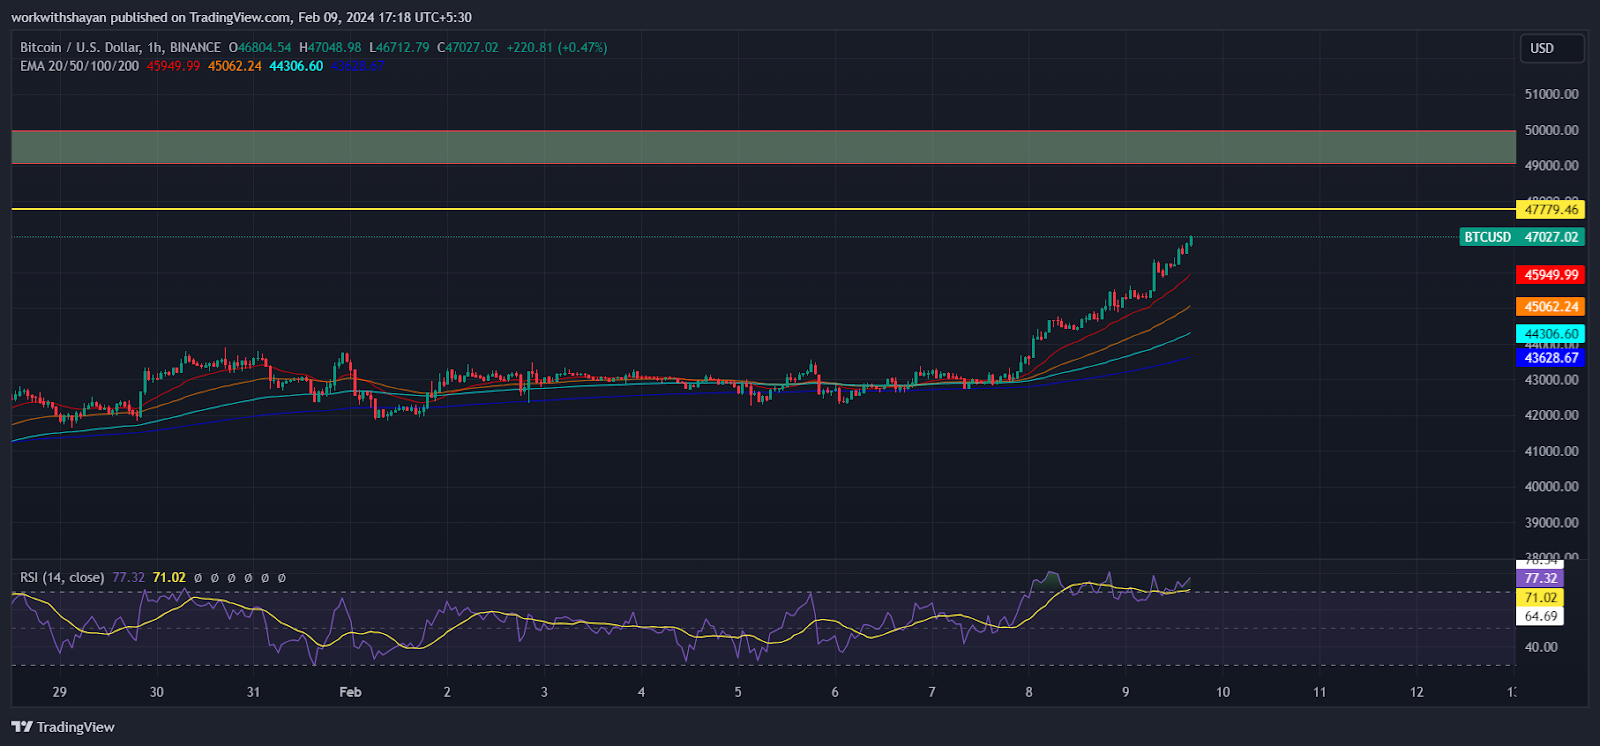
Currently, buyers seem to have the upper hand as the price has consistently stayed above the 20-day exponential moving average ($45,949). To maintain the current momentum, buyers need to breach the resistance at $48,000, potentially sending the $BTC/$USDT pair toward the key $50,000 mark.
However, should the price decline and fall beneath the 20-day EMA, it would suggest that sellers are gaining control. This could lead to a downturn towards $44,000, and possibly further down to $42K. At this juncture, a strong buying interest from buyers is anticipated, potentially stabilizing the price.
Jupiter ($JUP) Price Analysis
The bulls have successfully defended $JUP from bearish pressures, maintaining its position above $0.48 in recent days. However, bears aim for a short-term price correction in Jupiter price.
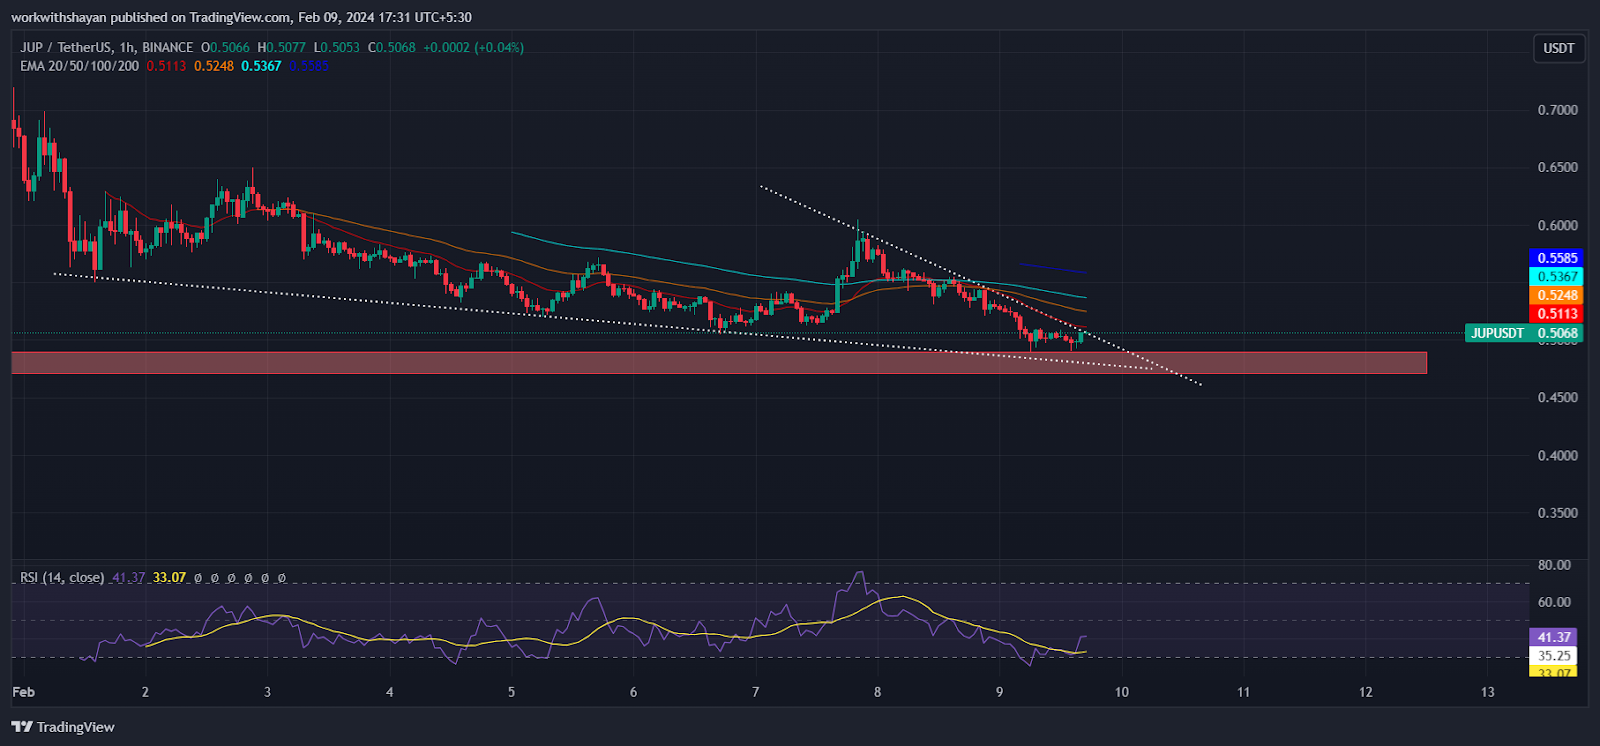
With the 20-day Exponential Moving Average (EMA) showing little deviation from $0.51 and the Relative Strength Index (RSI) below the midpoint, it suggests that bears still have an advantage. Should the buyers send the price beyond the current declining resistance line, the $JUP/$USDT pair might ascend to $0.55, and potentially reach $0.6 thereafter.
Conversely, a downturn below $0.48 would signal a shift in favor of the bears, potentially leading the pair to drop towards the crucial $0.45 support level. A breach of this threshold could result in a stronger bearish descending triangle pattern.
Solana ($SOL) Price Analysis
The bulls have been successful in initiating a recovery from the 20-day Exponential Moving Average (EMA) of $104 in
, which suggests a higher interest in buying at lower levels.
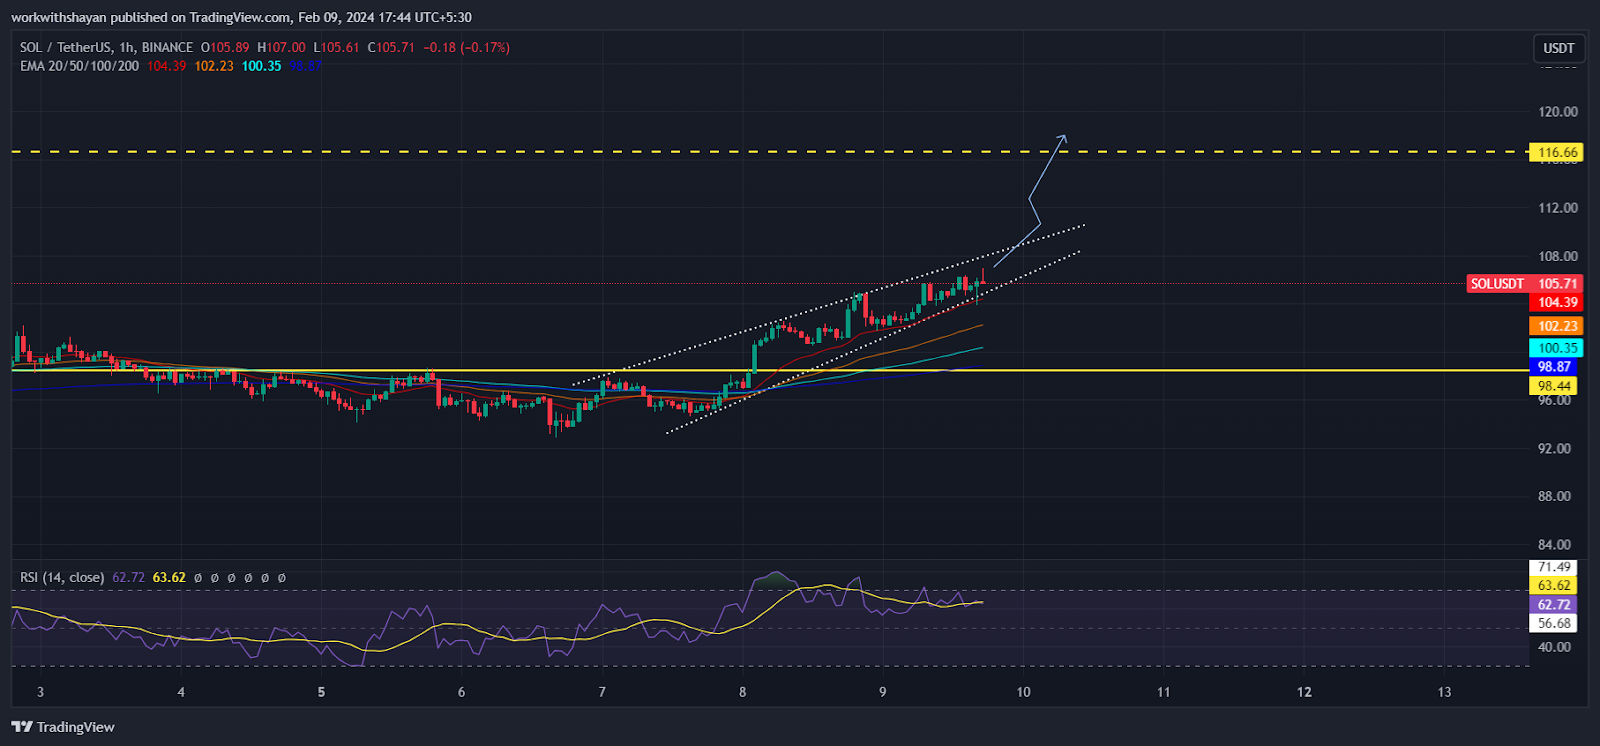
The first level of support lies at 20-day EMA. Should this support be breached, the $SOL/$USDT pair could experience a decline towards the robust support level at $98. A sharp recovery from $98 could retest the current resistance pattern. As the $SOL price now hovers below the resistance line, surpassing this resistance level might indicate that the pair could enter a phase of buying, breaking the $116 mark in no time.
For the bears to regain control, they must plunge and hold the price below $98, resulting in a consolidation around $80-$90.
Monero ($XMR) Price Analysis
The bulls are trying to keep $XMR above the $117 support level, as the quick recovery from the $100 low indicates that bullish pressure persists.
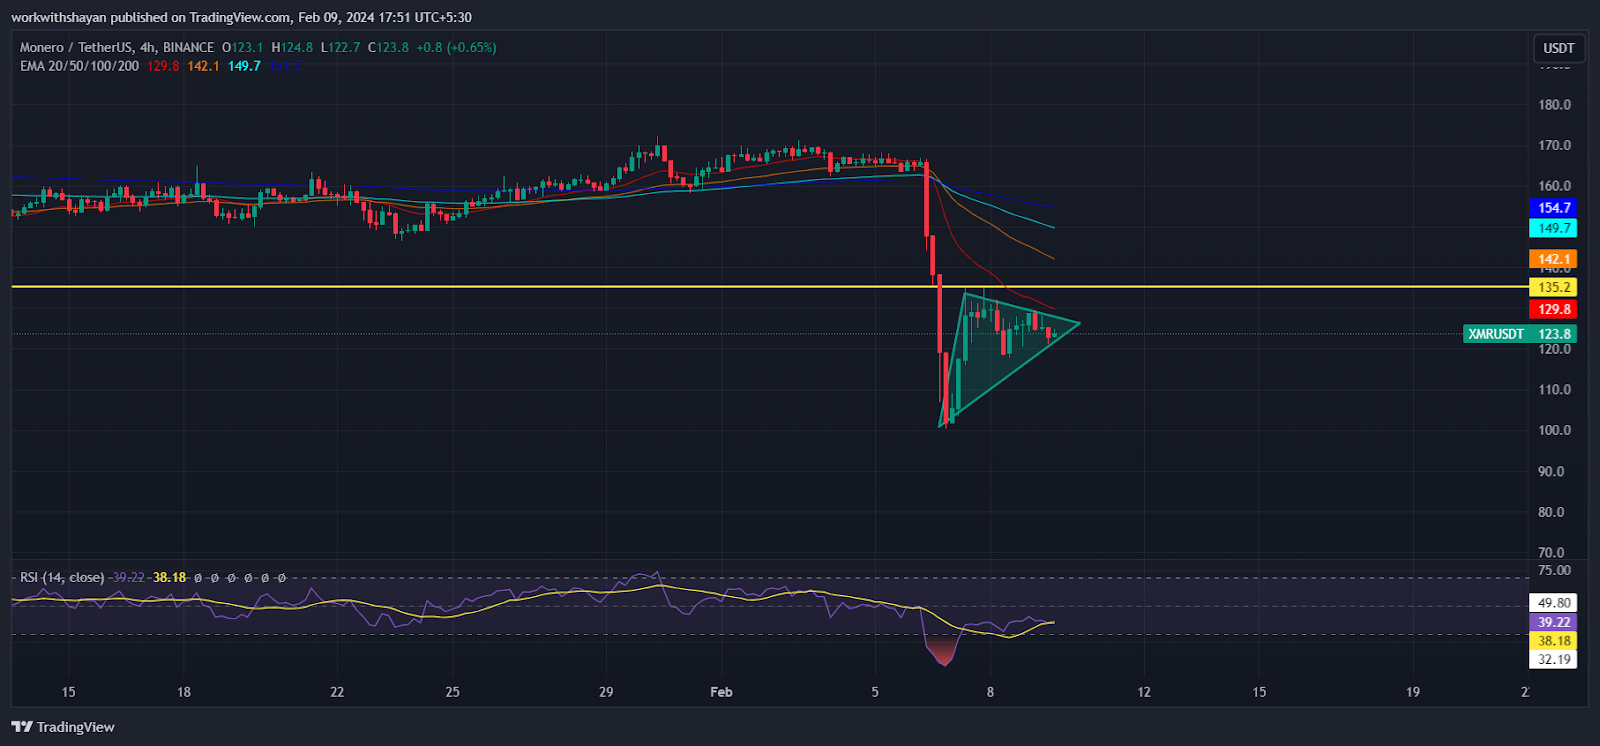
Should the $XMR/$USDT pair drop below $117, it might trigger a further decline towards the robust support at $100. This particular support has successfully halted declines on previous instances, suggesting that bulls might once again attempt to halt the downturn at this level.
For a sign that bears might be weakening, buyers need to drive and sustain the price above the 20-day Exponential Moving Average (EMA). Such a move could pave the way for an attempt to reach the buying region of $128, a critical threshold to monitor. Surpassing this line could be interpreted as the beginning of an uptrend, potentially leading to a rally up to $135.
Pyth Network ($PYTH) Price Analysis
$PYTH price is currently on an upward trajectory, although a reversal from $0.55 suggests that the higher levels are being staunchly defended by bears.
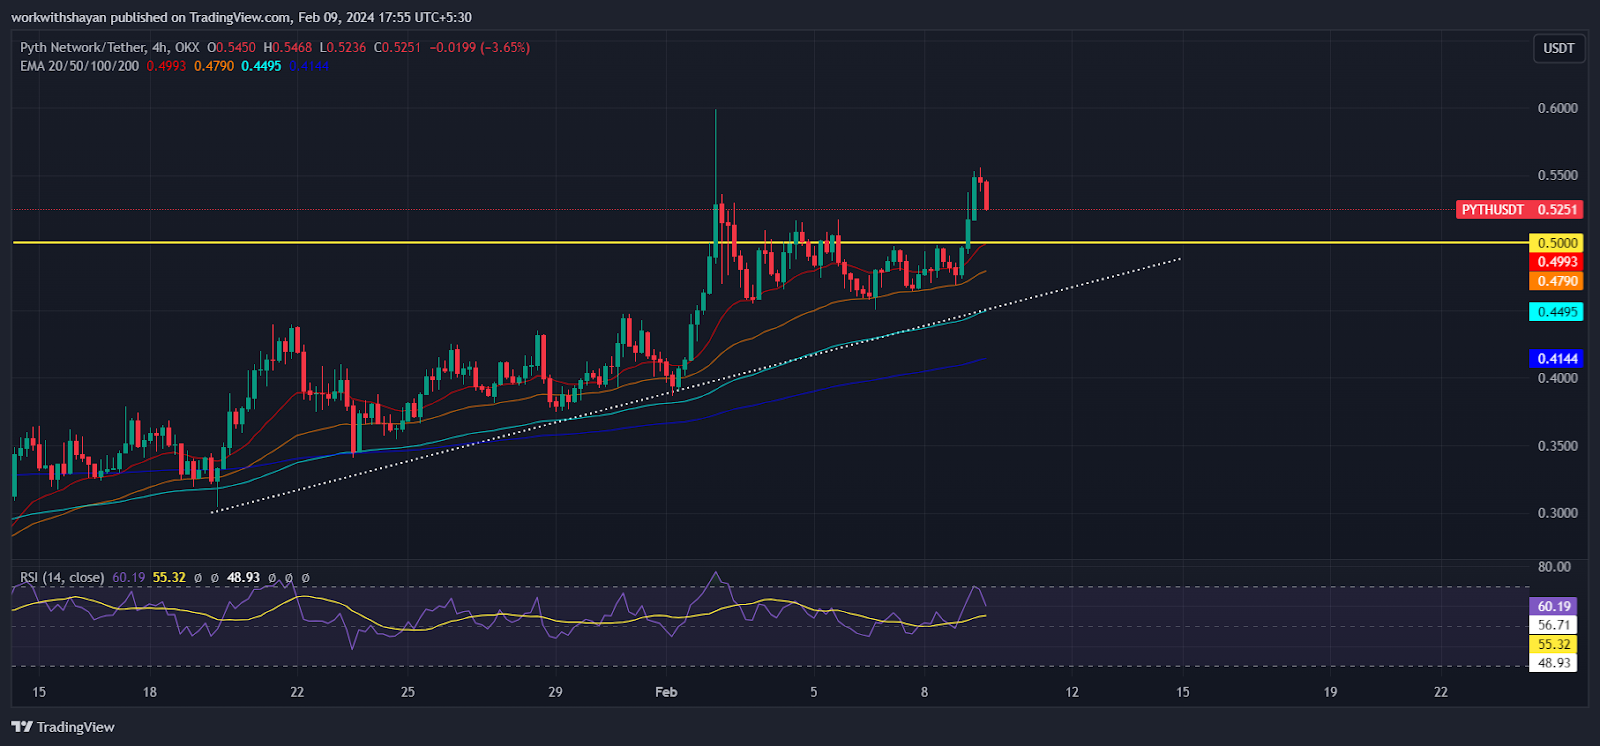
Typically, following a breakout from a consolidation range, prices tend to pull back to retest the breakout point. Therefore, the $PYTH/$USDT pair might see a decline to $0.5, a pivotal level worth monitoring.
Should the price recover from $0.5, it would signal that the bulls have successfully transformed this level into a support base, boosting the chances for the uptrend to resume. Following this, the pair could target a climb towards $0.6.
Conversely, this bullish scenario would be negated if the price were to fall and breach the 20-day Exponential Moving Average (EMA) at $0.49 in the near term.