- 1 The AAVE crypto price has fallen by 10.91% in the last week.
- 2 This crypto’s price is now at $83.33, down by 0.90% in the past 24 hours, with a market capitalization of $1.23 Million.
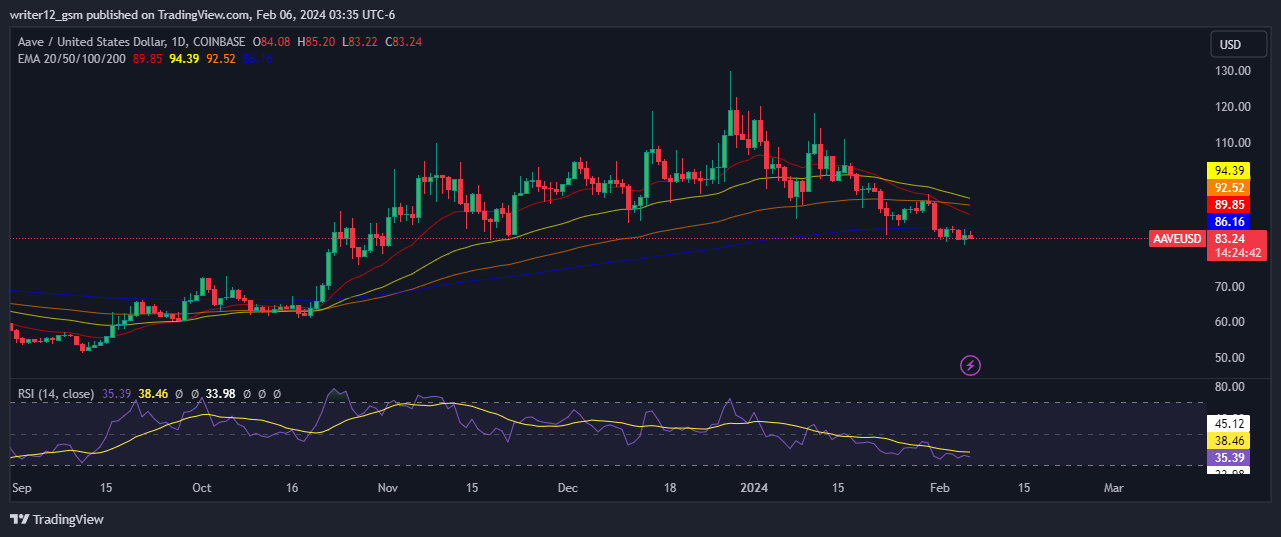
The AAVE crypto shows signs of weakness on the charts, as sellers dominate the market in recent sessions. The chart pattern also favors the bears, and the price forms doji candles, which indicate a struggle between bears and bulls.
At the moment, the AAVE crypto is at $83.33, with a drop of 1.00% within the day, showing bearishness. Buyers are trying to gain momentum in the market, but they can only hold on to some key support levels. The trading volume is 89.83 million. In addition, the Aave crypto implies more volatility in the next sessions.
Crypto is in a downtrend on the daily charts and has performed poorly in the previous months. The technical indicators also show bearishness, with no evidence of a bullish turnaround or bounce happening above the $80 level.
This crypto is facing strong resistance from the bears, who are trying to push the price below the key level, which is a crucial psychological barrier. The Aave crypto could have a significant impact on the AAVE crypto price, as it could either attract more investors to the AAVE ecosystem or create more competition and pressure for the AAVE coin.
On the 4-hour charts, the AAVE coin is under the influence of the sellers, and buyers cannot break the range of neutrality. The price movement shows that sellers are constantly resisting the bulls above the upper levels, erasing the gains from the top
Technical Analysis of AAVE Crypto Price in 1-D Timeframe

At the time of writing, AAVE crypto (USD: Aave) is trading above the 50 and 200-day EMAs (exponential moving averages), which are supporting the price trend.
However, if the selling volume increases, then the price could lose the SMA’s support by making lower highs and lows. Therefore, the Aave price is likely to move downwards, giving bearish views on the daily time frame chart.
The current value of RSI is 35.41 points. The 14 SMA is above the median line at 38.46 points, which means that the AAVE crypto is bearish.
The MACD line at -4.28 and the signal line at -3.80 are above the zero line. A bearish crossover is seen in the MACD indicator, which indicates more bearishness for the Aave crypto price.
Summary
AAVE (USD: Aave) crypto’s technical oscillators support the bearish trend. The MACD, RSI, and EMA are showing negative signs and suggest that the downtrend may persist in the Aave crypto price. The AAVE Price movement suggests that the investors and traders are bearish on the 1-D time frame. The price movement reflects a bearish outlook at the present.
Technical Levels
Support Levels: $80.00 and $70.00.
Resistance Levels: $86.16, and $89.99.
Disclaimer
This article is for informational purposes only and does not provide any financial, investment, or other advice. The author or any people mentioned in this article are not responsible for any financial loss that may occur from investing in or trading. Please do your own research before making any financial decisions
Andrew is a blockchain developer who developed his interest in cryptocurrencies while pursuing his post-graduation major in blockchain development. He is a keen observer of details and shares his passion for writing, along with coding. His backend knowledge about blockchain helps him give a unique perspective to his writing skills, and a reliable craft at explaining the concepts such as blockchain programming, languages and token minting. He also frequently shares technical details and performance indicators of ICOs and IDOs.
 thecoinrepublic.com