Markets have entered a consolidation period with minimal movements, as the global market cap is sitting at 0.09% below its previous 24-hour mark, and the total cap stands at $1.65T as of press time. The fear and greed index is 56, as markets remain neutral. The global trading volume is down 24% in 24 hours.
Bitcoin Price Analysis
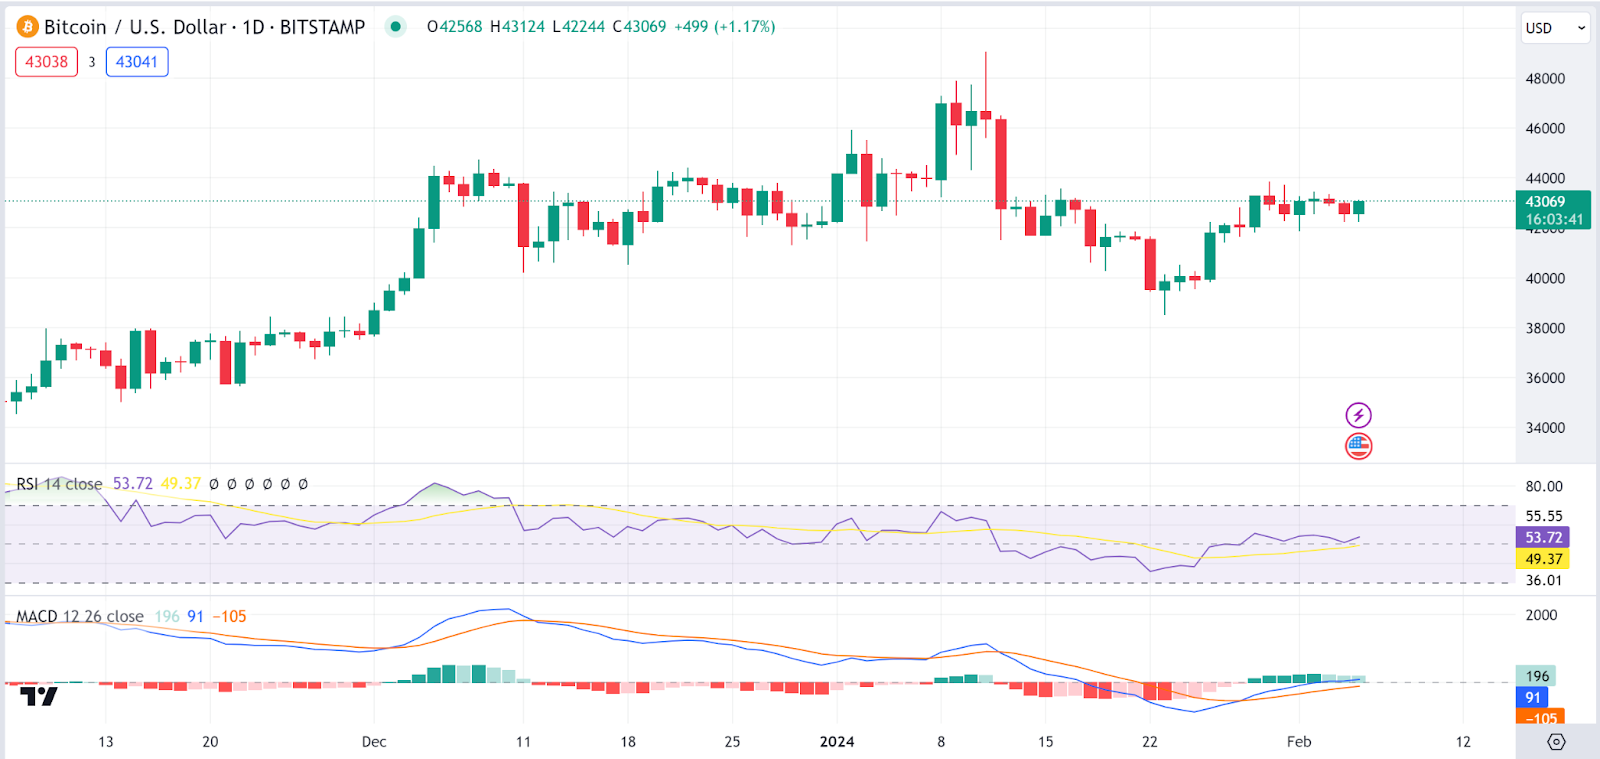
Bitcoin (BTC) has reclaimed the $43K mark once again, as the Bitcoin price stood at $43.09K as of press time after recording a daily increase of 0.65% and a weekly rise of 2.5%. As a result of the Bitcoin price, the token’s trade volume jumped by 25% during the same period and is presently at $15.3B.
Bitcoin to U.S. Dollar (BTC/USD) daily chart shows that the Relative Strength Index (RSI) is neutral at around 53, and the Moving Average Convergence Divergence (MACD) (blue line) is slightly above the signal line (orange line), suggesting a mild bullish momentum on the Bitcoin price.
Ethereum Price Analysis
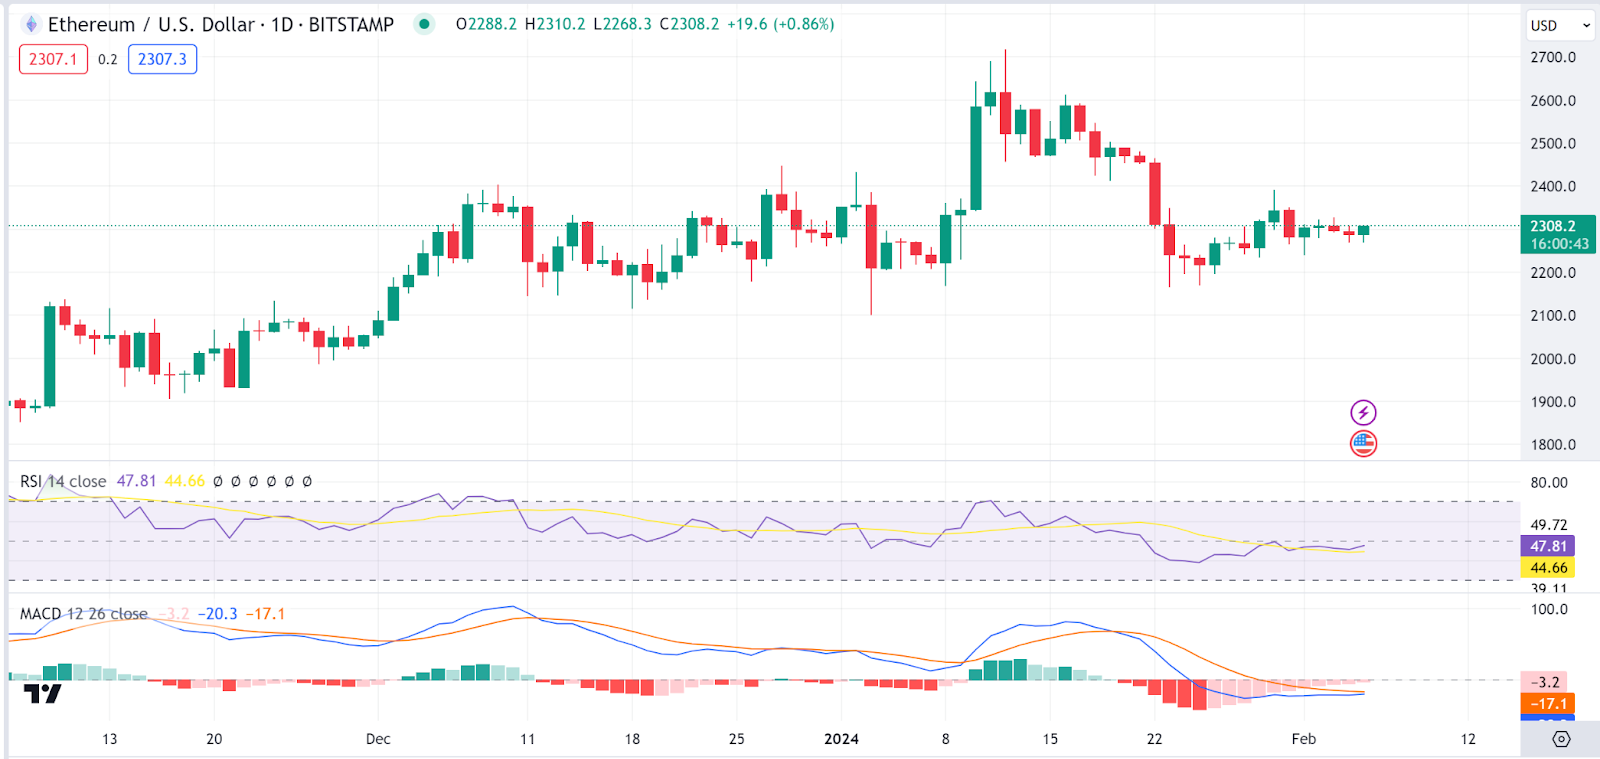
Ethereum (ETH) has also seen minor gains today, as the Ethereum price stood at $2309 as of press time after recording a daily increase of 0.8% and a weekly rise of 2.17%. As a result of Ethereum’s price, the token’s trade volume jumped by 34% during the same period and is presently at $5.9B.
Ethereum to U.S. Dollar (BTC/USD) daily chart shows that the Relative Strength Index (RSI) is neutral at around 47.8 as it heads north. The Moving Average Convergence Divergence (MACD) (blue line) is headed for a crossover above the signal line (orange line) as the histograms head towards the zero line, also suggesting building bullish momentum on the Ethereum price.
BNB Price Analysis
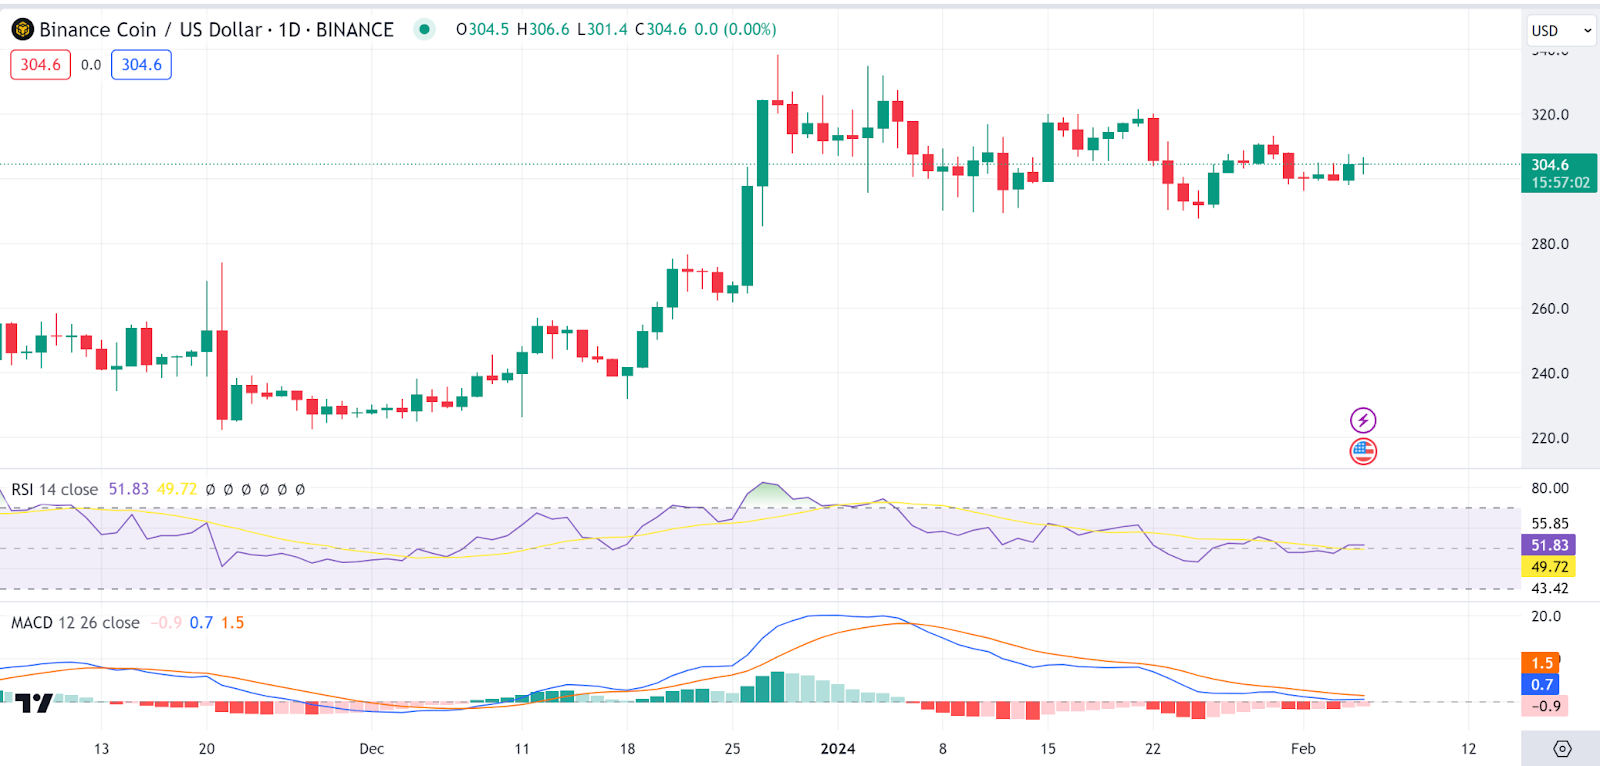
BNB (BNB)is another gainer today, as the BNB price stood at $304.5 as of press time after recording a daily increase of 1.7% to bring the weekly drop to 0.47%. As a result of BNB’s price, the token’s trade volume jumped by 54% during the same period and is presently at $925M.
Looking at the 24-hour BNB/USD chart, we see that the Relative Strength Index (RSI) appears to be around the midpoint at approximately 51.83, suggesting that the coin is neither overbought nor oversold. The Moving Average Convergence Divergence (MACD) shows a slight bullish crossover with the signal line above the MACD line, which could be interpreted as a positive short-term momentum for the BNB price.
Internet Computer Price Analysis
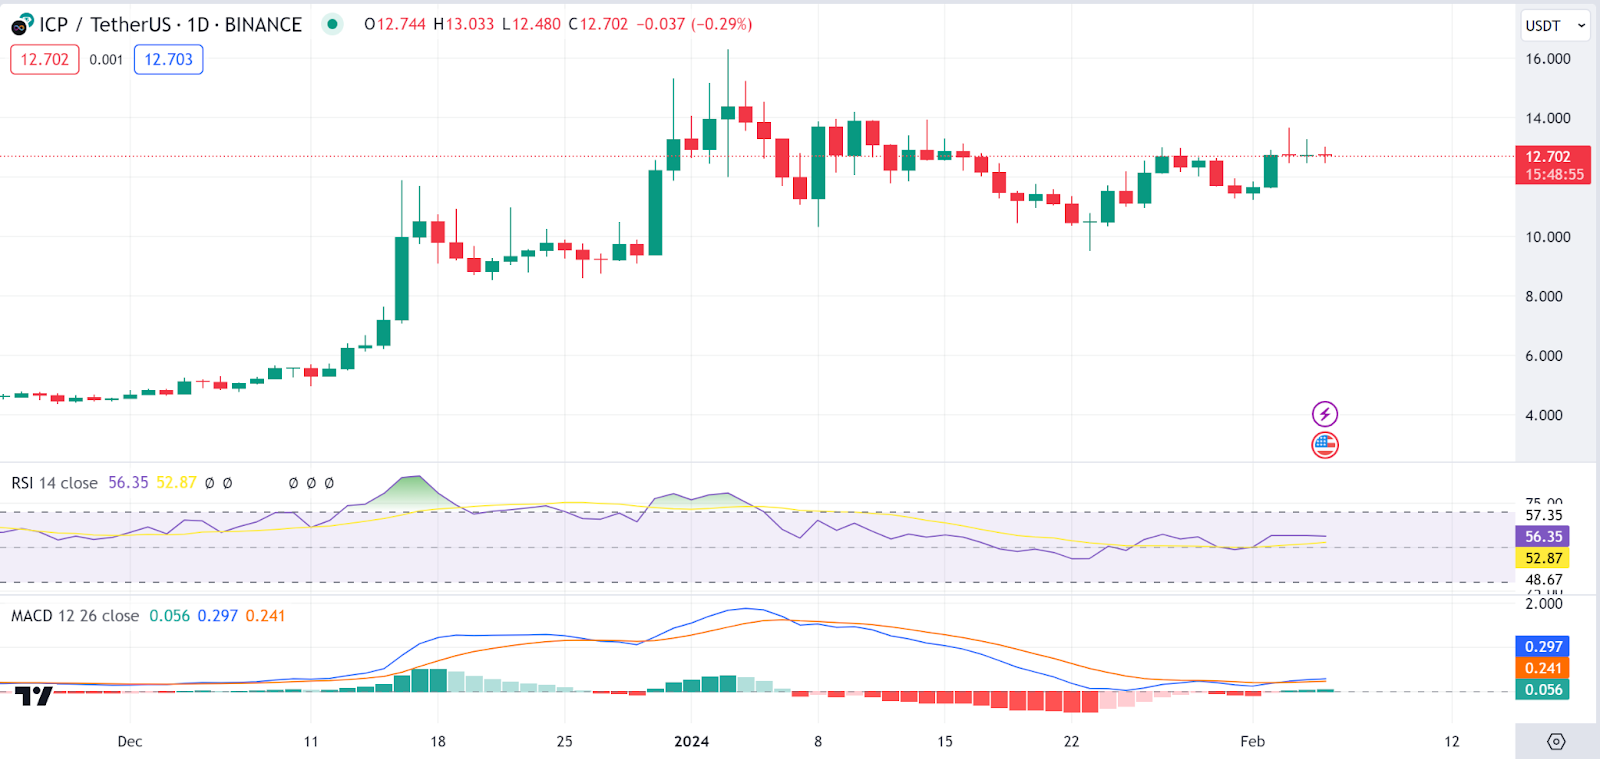
Internet Computer (ICP)is also a gainer today, as the Internet Computer price stood at $12.71 as of press time after recording a daily increase of 1.4% to bring the weekly rise to 4%. As a result of ICP’s price, the token’s trade volume jumped by 7.5% during the same period and is presently at $142M.
Looking at the 24-hour ICP/USDT chart, we see the Relative Strength Index (RSI) slightly above neutral at 56.35, indicating that the asset is neither overbought nor oversold, and there is potential room for movement in either direction without hitting extreme conditions. The Moving Average Convergence Divergence (MACD) is above the signal line, typically suggesting bullish momentum. However, the histogram is decreasing, indicating that the bullish momentum on the Internet Computer price may be losing strength.
Sui Price Analysis
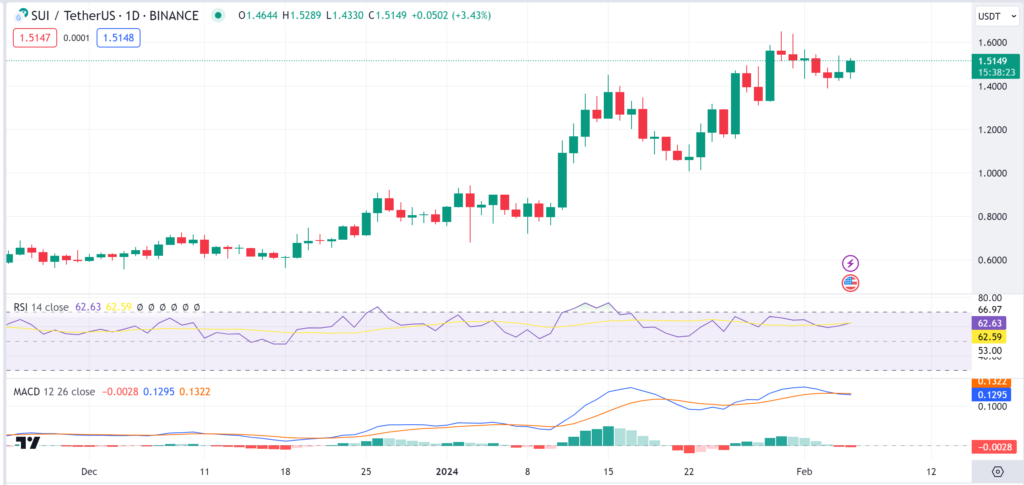
Sui (SUI) is also a gainer today, as the Sui price stood at $1.52 as of press time after recording a daily increase of 2.5% to bring the weekly rise to 8%. As a result of SUI’s price, the token’s trade volume jumped by 16% during the same period and is presently at $354M.
Looking at the 24-hour SUI/USDT chart, we see the Relative Strength Index (RSI) is moderately high at 62.63, which may indicate that the asset is approaching overbought territory but is not there yet. The Moving Average Convergence Divergence (MACD) is positive with the MACD line above the signal line, suggesting a bullish trend on the Sui price, and the histogram bars are growing in height, indicating increasing bullish momentum on the Sui price.
