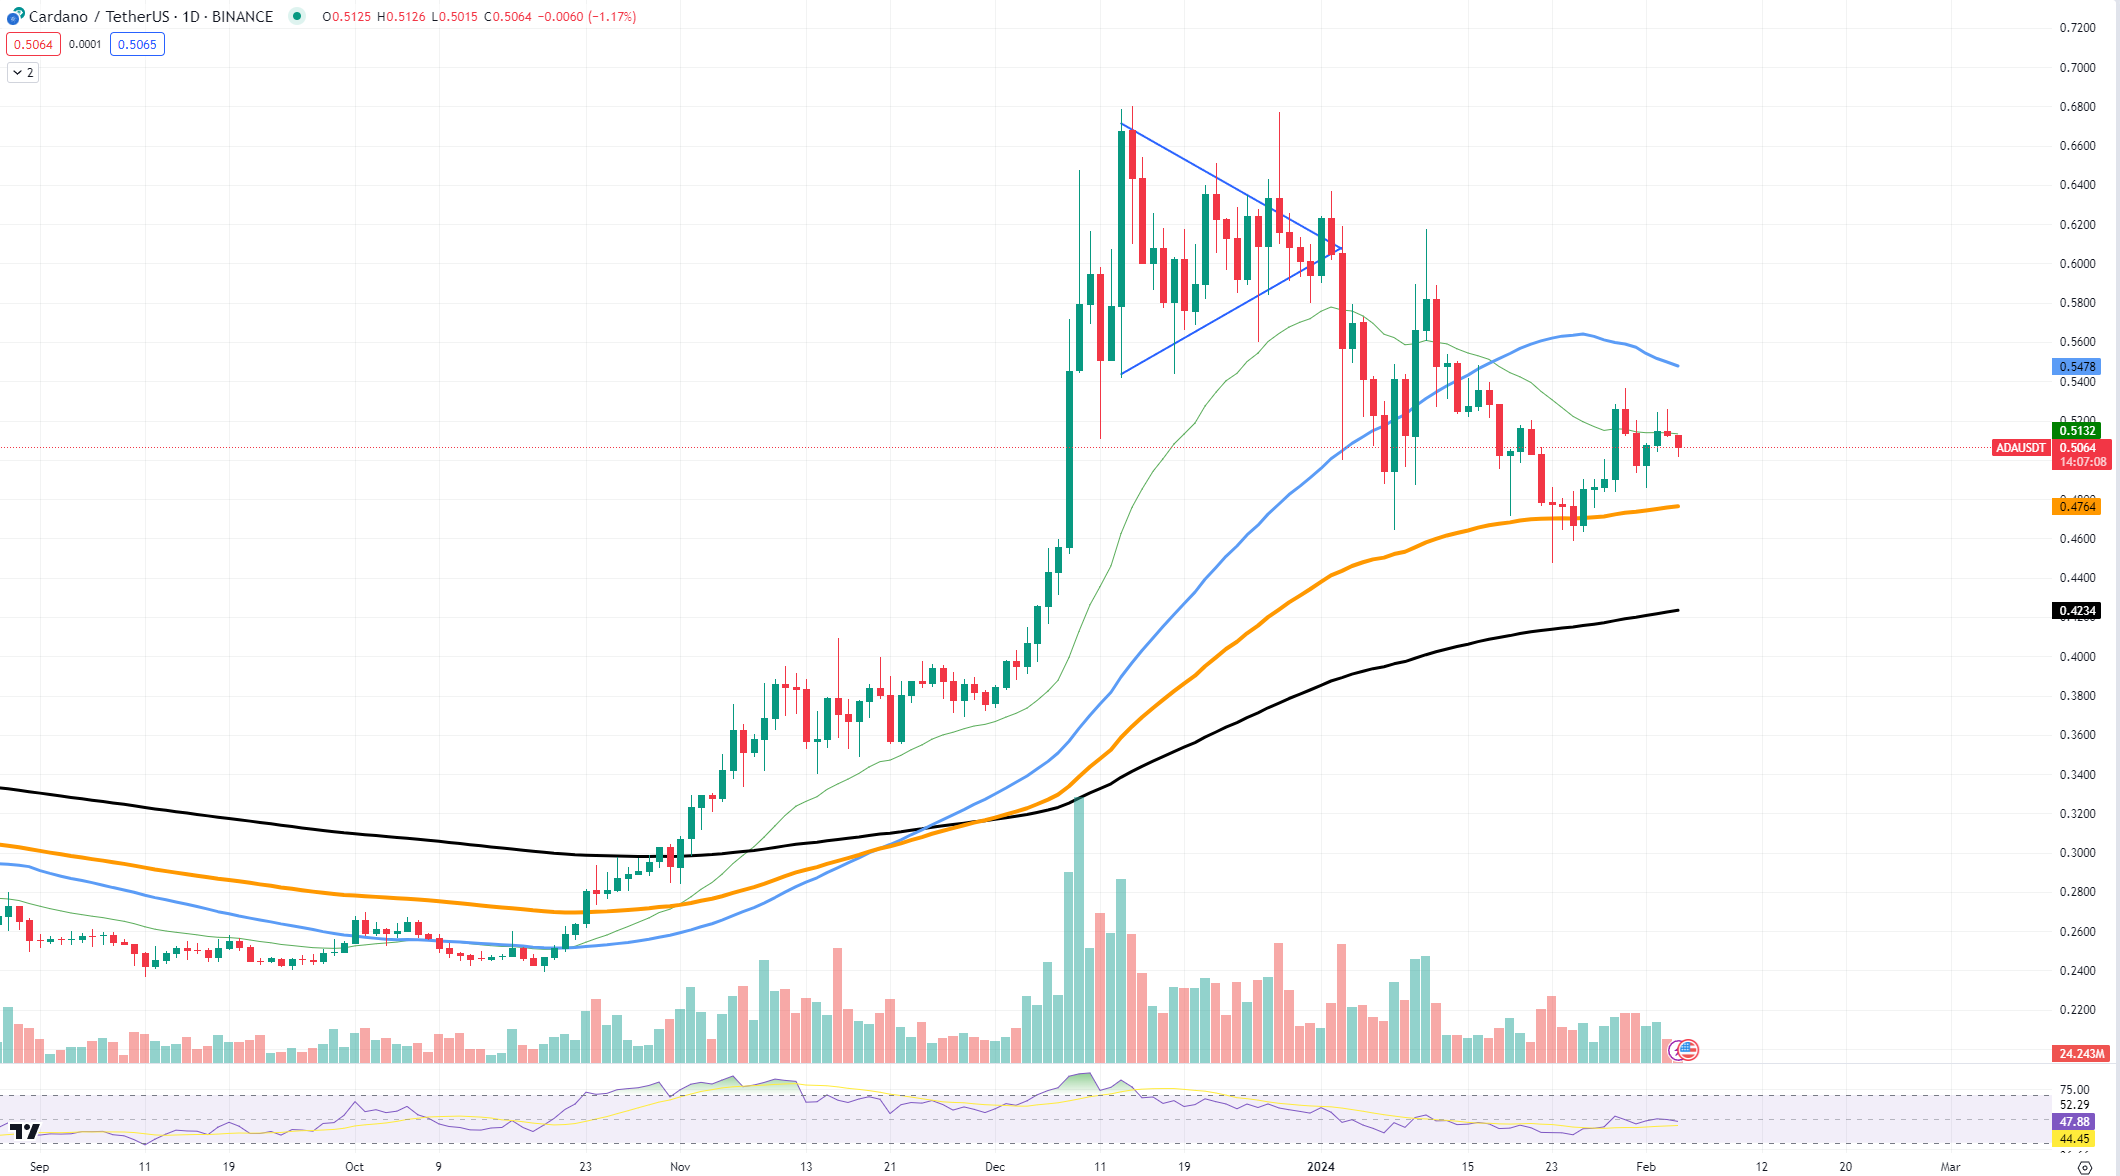
Cardano experienced a harsh rejection at a key technical level, signaling potential challenges ahead for the digital asset. The 26-day exponential moving average (EMA), typically considered a minor support structure for assets undergoing consolidation, proved to be an insurmountable barrier for ADA's price.
This level, often serving as a litmus test for short-term market sentiment, has underscored a bearish stance as ADA failed to secure its footing above it.

The price chart illustrates ADA's struggle to maintain upward momentum, with a stark rejection observed at the 26 EMA, marked by a price of approximately $0.5478. This level of resistance has not only halted its ascent but also implies a more profound resistance than previously anticipated. The rejection at this threshold is particularly telling, as the 26 EMA is not typically characterized by such significant price action.
ADA's immediate support is now placed at around $0.4763, a level that could serve as a foundation for any potential rebounds. However, given the strength of the recent rejection, the asset's price is more likely to test the more robust support level at $0.4234, which is situated near the 200-day SMA, a critical long-term indicator that often acts as a significant psychological and technical support level.
Digital assets losing to USD
The U.S. Dollar Index, which measures the strength of the dollar against a basket of six major currencies, has recently seen a significant surge, causing ripples of concern through the cryptocurrency market.
The unchanged interest rates and a prevailing risk-off sentiment in the markets have contributed to pushing the DXY to new highs. This rise is a bearish sign for cryptocurrencies, suggesting that digital assets may face a tough road ahead.
From a technical standpoint, the DXY is showing strong bullish momentum. The index has breached a critical resistance level at 103.5, which now serves as a support level, indicating a strong upward trend. The next resistance is found at the recent peak near 104.5, which, if broken, could signal continuation toward higher levels not seen in recent history.
The surge in the dollar's strength typically leads to a decrease in risk appetite among investors. This shift causes funds to flow out of riskier assets, such as cryptocurrencies, and into what is perceived as the relative safety of the dollar.
XRP on edge of reversal?
XRP's chart is showing possible early signs of a reversal, intriguing market participants. A closer look at the price movement and volume indicators might suggest that a change in the prevailing downtrend could be on the horizon.
Analyzing the chart, XRP has shown resilience at the $0.5387 support level. This is critical as it aligns with historical price reactions, indicating a strong psychological and technical threshold for the market's participants. The resistance to watch is currently at $0.5730, where XRP has faced multiple rejections in the recent past. A decisive close above this level could signal a shift in market sentiment from bearish to bullish.
Moreover, the potential reversal is being hinted at not just by price action but also by market behavior. An increase in the liquidation of short positions suggests that bears may be losing their grip. The squeeze on shorts, particularly if the price begins to tick upward, could contribute to a swift change in price direction. This is because as short positions are closed, it necessitates the purchase of XRP to cover, which can drive the price higher and potentially initiate a reversal.
The specific continuation scenario for XRP would involve breaking through the $0.5730 resistance level and holding above it. This would likely lead to a series of short liquidations, adding fuel to the upward momentum. Subsequently, if this bullish scenario unfolds, XRP could test the next resistance near $0.60, a level which would confirm a stronger reversal trend is in place.
 u.today
