- 1 $APE crypto price slips below the critical support zone of $1.40.
- 2 Apecoin depicts a rounding top formation, revealing a sell-off.
$APE crypto price illustrates a trend reversal and furnishes a lapse from the highs of $1.90 near the 200-day EMA mark. Moreover, the coin portrays a rounding top formation and slides to the lower neckline of $1.20. However, a breakdown is pending, as the sellers could soon breach the prompt support mark of $1.20. However, the bulls stretched to preserve the gains and formed a hammer candlestick on the bottom.
Apecoin price declines below the key moving averages and portrays a selloff in the recent sessions. Furthermore, the coin may resume to drag the gains and will proceed to the lows of $1 soon. The trend is adverse, and the coin failed to extend the gains while a pullback faced a severe push near the 200-Day EMA region. Per the Fib levels, $APE crypto price has retested the 23.6% zone during the pullback but failed to hold and faced rejection.
The cryptocurrency price was $1.37 at press time, with an intraday drop of 3.63%, showing a selloff. Moreover, the trading volume increased by 5.95% to $36.02 Million, highlighting a correction from the highs. The pair of $APE/$BTC was noted at 0.0000320 $BTC, and the market cap is $180.60 Million. Analysts are bearish and suggest that the $APE price will persist in a downtrend and may retest $1 soon.
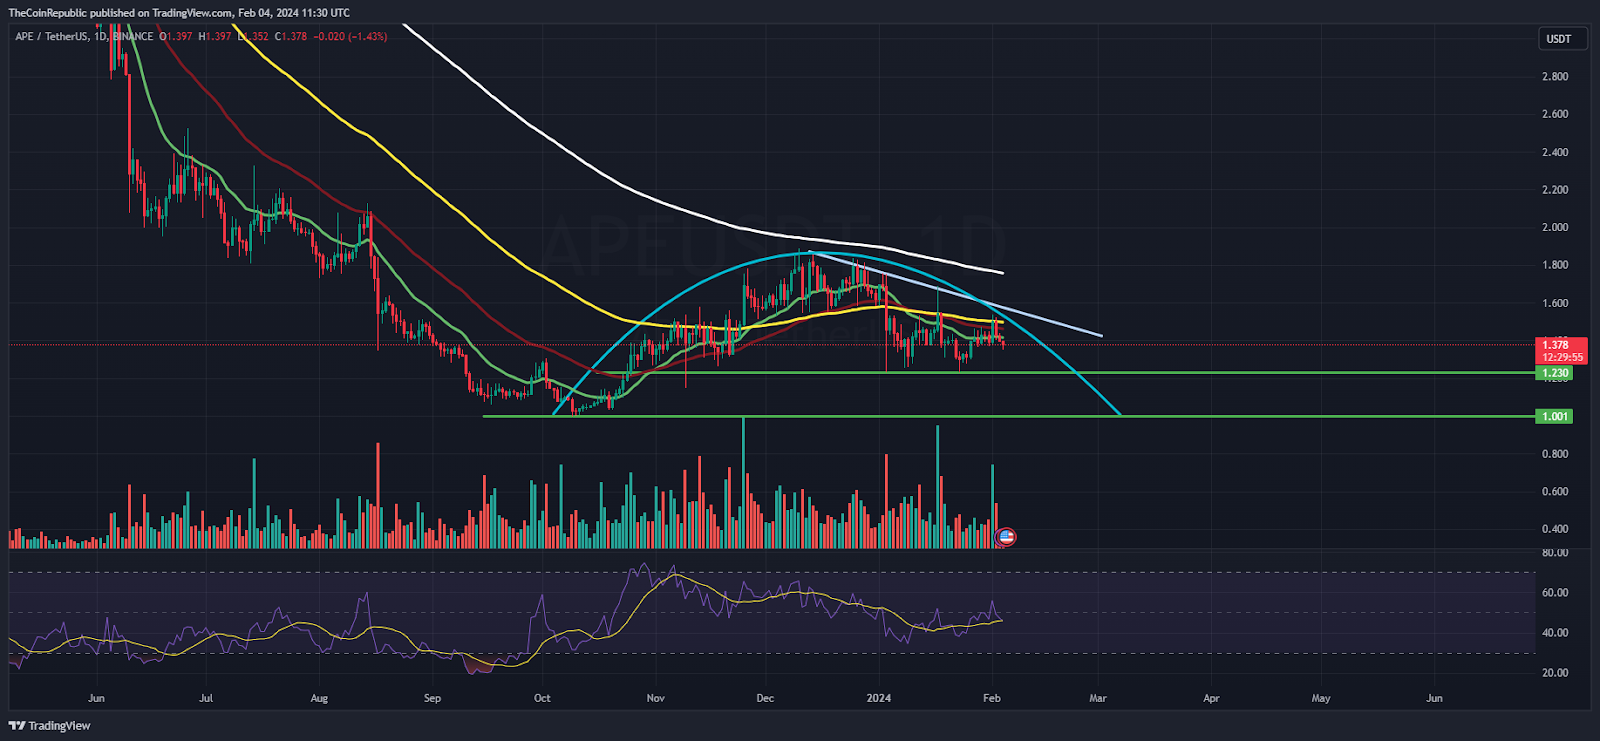
$APE On Daily Chart Displays Rounding Top Pattern
 $APE Price Prediction: Is $APE Ready For A Downmove Below $1.20?">
On the daily chart, $APE price implied a downtrend and has persisted in losing gains from the highs, directing bearishness for the past weeks. Furthermore, the trend favors the bears and suggests that the downfall may go beyond $1 in the following sessions.
The Relative Strength Index (RSI) curve stays below the midline and forms a negative divergence, implying a bearish outlook on the charts. Moreover, the MACD indicator shows a bearish crossover and formed red bars on the histogram, suggesting the underperformance will continue in the following sessions.
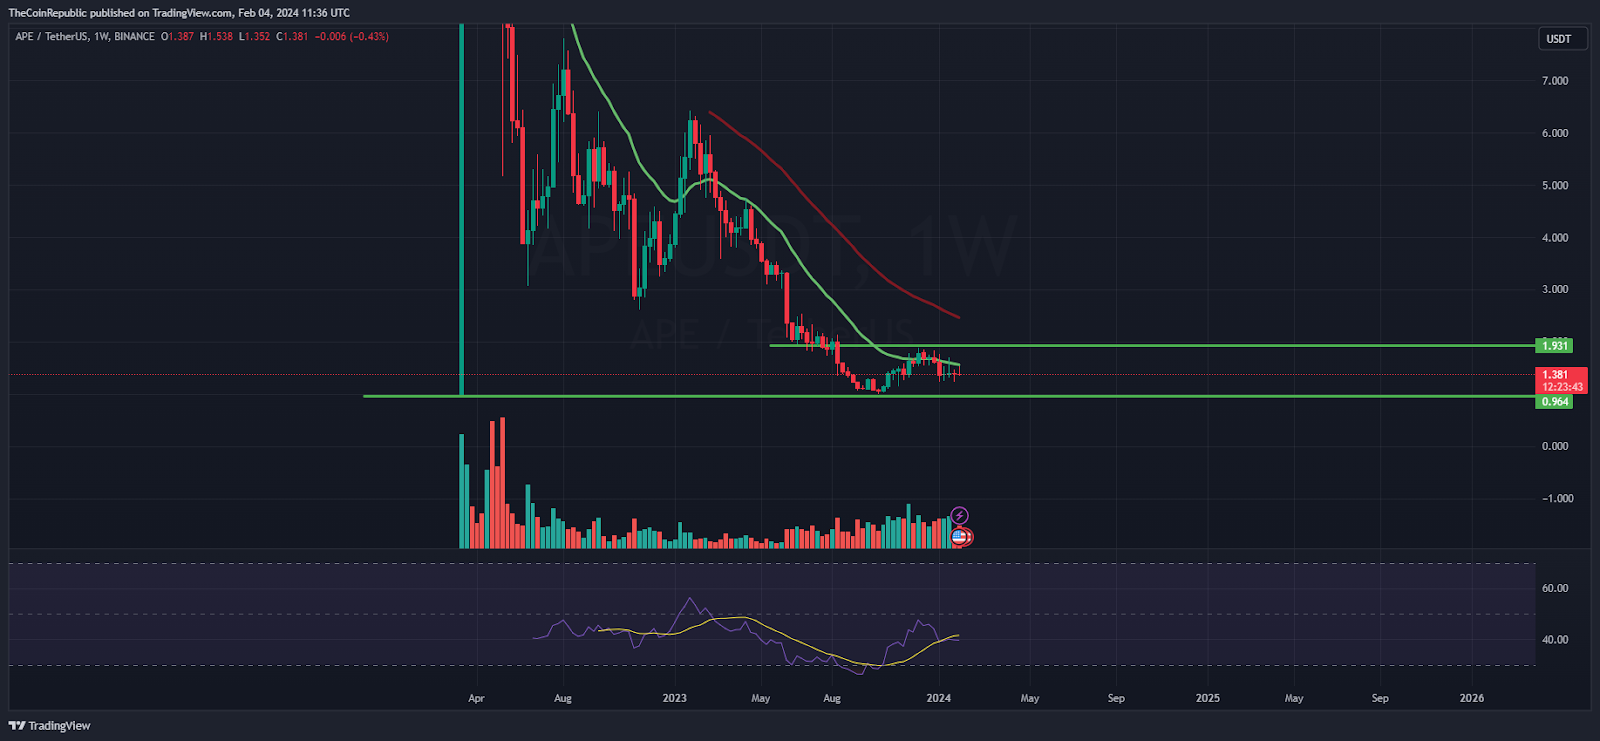
$APE On Weekly Chart Reveals Bearish Outlook
 $APE Price Prediction: Is $APE Ready For A Downmove Below $1.20?">
On the weekly charts, Apecoin price has retested the 52-week lows and showed a pullback in the recent sessions. However, the rebound did not last longer, and a rejection from the 20-Day EMA was witnessed. Afterward, $APE crypto reverted gains and will retest the demand zone of $1 in the following sessions.
Summary
$APE crypto price slips below its critical support zone of $1.50 and is heading to retest the lows of $1. Additionally, the trend is bearish, and the coin will continue to deliver a sell-off in the upcoming sessions. Amidst the correction, $APE crypto did not manage the gains and persisted in a severe downfall.
Technical Levels
Support Levels: $1.20 and $1
Resistance Levels: $1.50 and $1.70
Disclaimer
The views and opinions stated by the author or any other person named in this article are for informational purposes only and do not constitute financial, investment, or other advice. Investing in or trading crypto or stocks comes with a risk of financial loss.
Nancy J. Allen is a crypto enthusiast, with a major in macroeconomics and minor in business statistics. She believes that cryptocurrencies inspire people to be their own banks, and step aside from traditional monetary exchange systems. She is also intrigued by blockchain technology and its functioning. She frequently researches, and posts content on the top altcoins, their theoretical working principles and technical price predictions.