
- 1 The $QNT token price shifted to the round mark of $100 and is facing a selloff.
- 2 Buyers are in trouble and are attempting to hold the gains.
Quant ($QNT) token price continued dragging the gains and is replicating correction in recent weeks. Moreover, the token has eroded over 30% of gains this month and noted selling pressure from the highs. The price action implies lower low formation and forms a falling wedge pattern, which reveals a downtrend.
The Quant price slipped to the round mark of $100 and is facing a selloff in the recent sessions. The price action signifies the lower lows formation and conveys that buyers have trapped and are unwinding their positions, whereas sellers have an edge now and are preparing to breach $100 to extend the downfall. Per the Fib levels, the $QNT price has breached the 38.2% zone and is close to the 23.6% zone.
The cryptocurrency price was $103.40 at press time, with an intraday gain of 0.16%, showing bearishness. Moreover, the trading volume remained average at $14.03 million, highlighting low investor interest. The pair of $QNT/$BTC was noted at 0.00240 $BTC, and the market cap is $1.01 Billion. Analysts are bearish and suggest that $QNT crypto will deliver volatility and may breach $100 soon.
$QNT On Daily Charts Displays Falling Wedge Formation
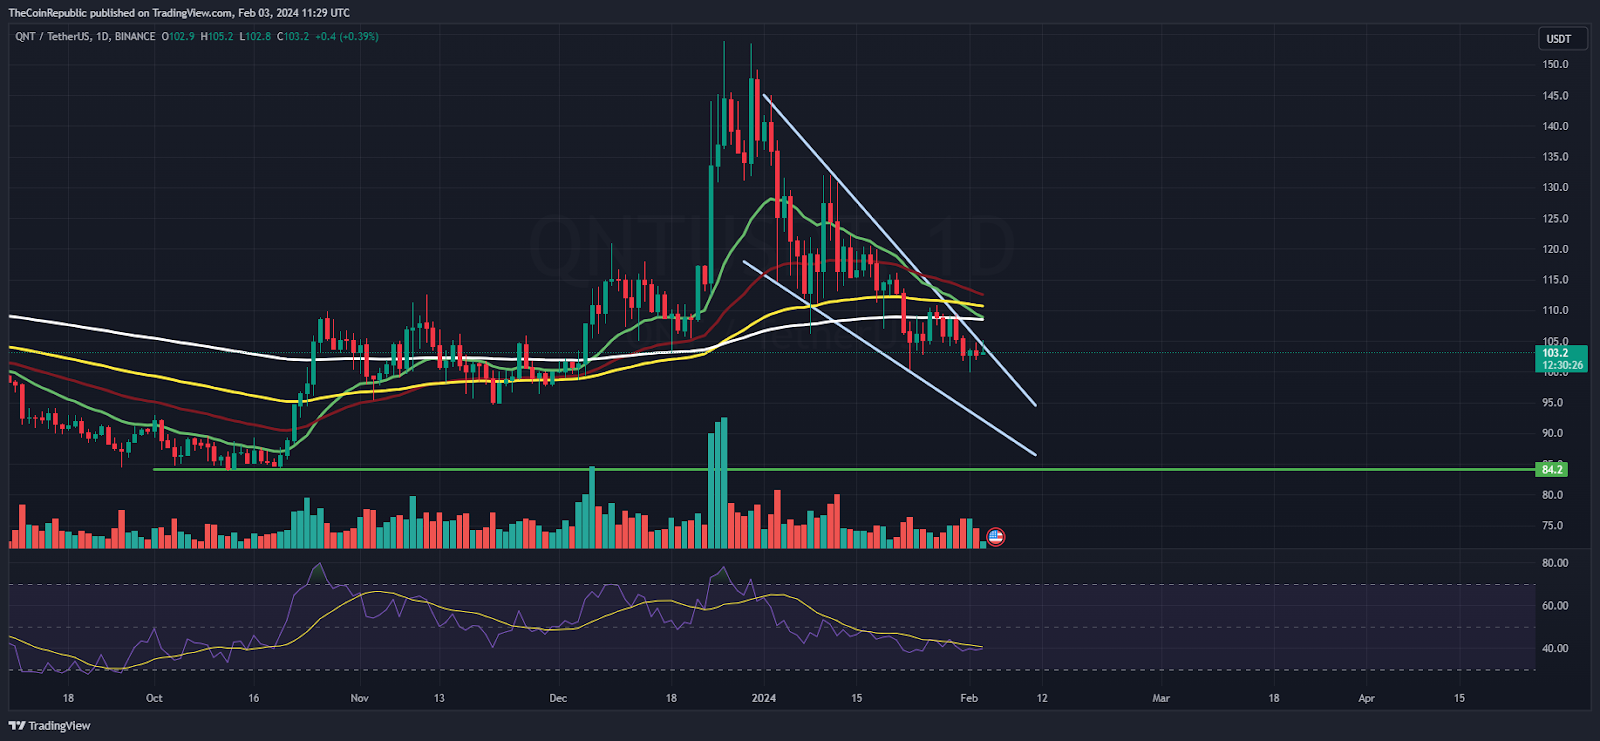
On the daily charts, $QNT price showcased a correction and noted a falling wedge pattern, which reveals follow-on selling pressure and mighty bears looked aggressive and are in the mood of hurting the mark of $100. The technicals suggest a down move, and the buyers are challenged to hold the gains despite the short buildups.
The RSI curve stays in the oversold region and shows a negative divergence, replicating the selling momentum on the charts. Moreover, the MACD indicator shows a bearish crossover and formed red bars on the histogram, suggesting the underperformance may continue in the following sessions.
$QNT On Weekly Charts Reveals Rejection From 100-Day EMA Mark
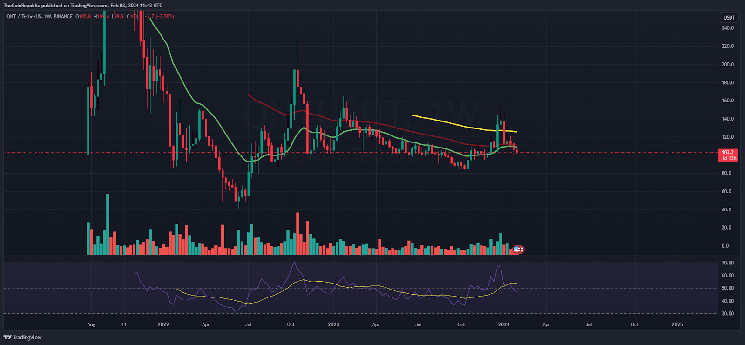
On the weekly charts, Quant crypto price recovered from the bottom zone of $80 and poured over 100% toward $150. Furthermore, a doji candlestick followed by a bearish marubozu candle spoiled the gains sharply, resulting in a drawdown of the token. Afterward, the token could not manage the gains and persisted in dragging gains revealing the bears’ dominance. Per the technicals, Quant crypto may continue to suffer bearishness and will retest $80 soon.
Summary
Quant ($QNT) signifies a downtrend and is headed to the round level of $100, the make-or-break zone. If the token settles above it, the price will try to hold and rebound. Suppose it breaks, it will go toward the support mark of $80 in the following sessions.
Technical Levels
Support Levels: $100 and $92
Resistance Levels: $105 and $120
Disclaimer
The views and opinions stated by the author or any other person named in this article are for informational purposes only and do not constitute financial, investment, or other advice. Investing in or trading crypto or stocks comes with a risk of financial loss.
Nancy J. Allen is a crypto enthusiast, with a major in macroeconomics and minor in business statistics. She believes that cryptocurrencies inspire people to be their own banks, and step aside from traditional monetary exchange systems. She is also intrigued by blockchain technology and its functioning. She frequently researches, and posts content on the top altcoins, their theoretical working principles and technical price predictions.