- 1 The $GAS token price showcased a range bound move and depicts low investor interest.
- 2 The token failed to gain momentum and is hovering near $5.50 showing bearishness.
The $GAS token price reveals consolidation and has hovered between the price bands of $5 and $7 over the past few weeks. The token depicts correction from the highs of $25 and is approaching the bearish trajectory below $10 for the past sessions. However, the token is in the correction phase and delivers low investor interest.
The $GAS price slips below the 20, 50, and 100-day EMAs and is close to the 200-day EMA mark revealing a downtrend on the charts. Moreover, the token has persisted in a downtrend and is delivering low investor interest. If the token slips below the lower neckline of the zone, the token may retest the demand zone of $3.00.
The cryptocurrency price was $5.70 at press time, with an intraday drop of 0.56%, showing consolidation. Moreover, the trading volume remained average, at $15.67 Million, highlighting low investor interest. The pair of $GAS/$BTC was noted at 0.000132 $BTC, and the market cap is $547.47 Million. Analysts are bearish and suggest that the $GAS price will continue to hover in the range and may breach $5 soon.
$GAS on Daily Charts Replicates Consolidation
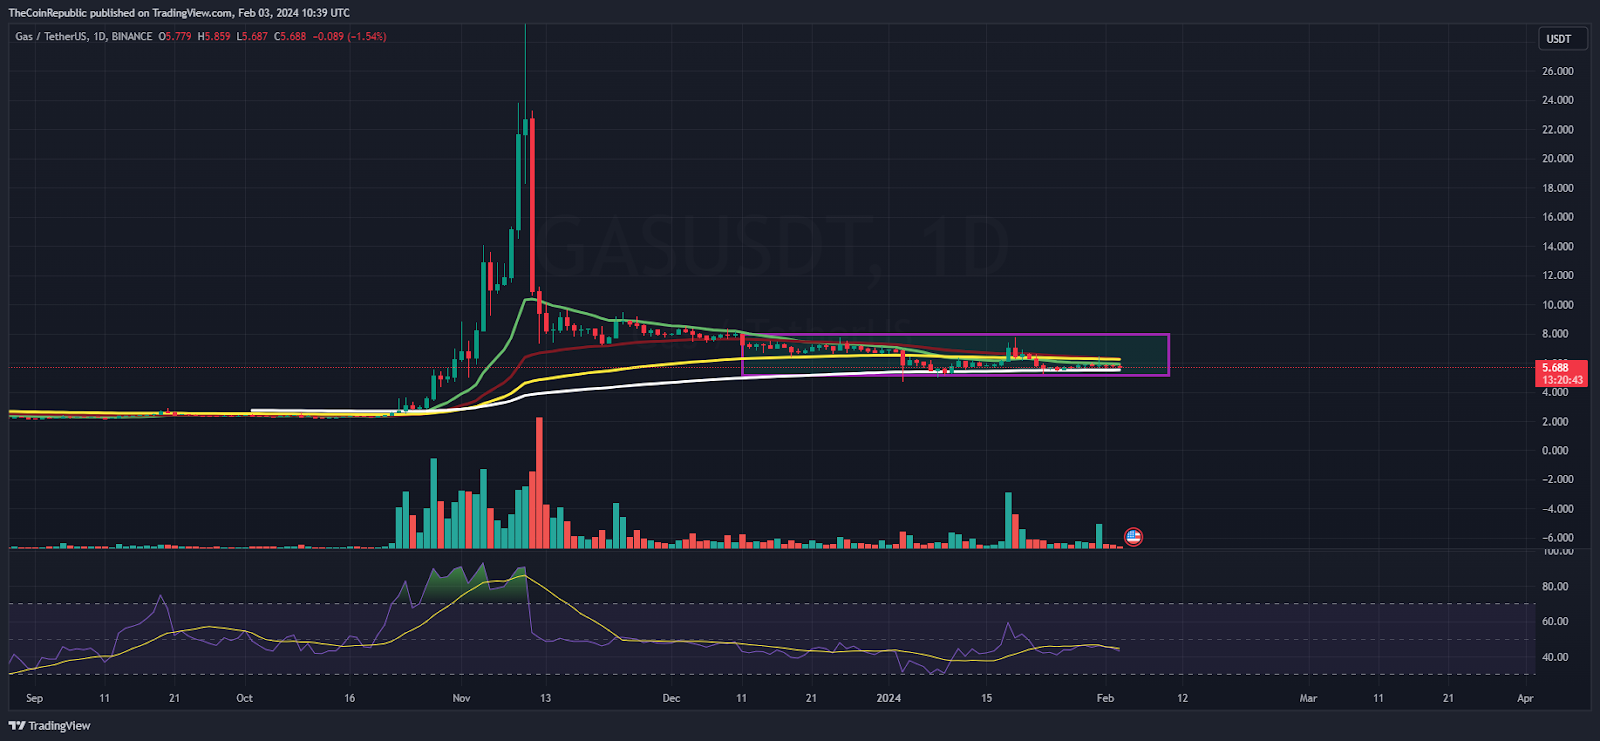
On the daily charts, the $GAS price hovers in a biased range and depicts a correction in the past sessions. The token reveals a downtrend, and the sellers have persisted in adding short positions, but a down move is still pending, which is anticipated in the upcoming sessions. The token may attain bullishness only if it sustains above $5.80, which is the prompt hurdle.
The RSI curve stayed close to 50, showing a neutral outlook and depicting a consolidating price action. The MACD indicator shows a bearish crossover and suggests a downfall in the coming sessions.
$GAS on Hourly Charts Exhibits Symmetrical Triangle Formation
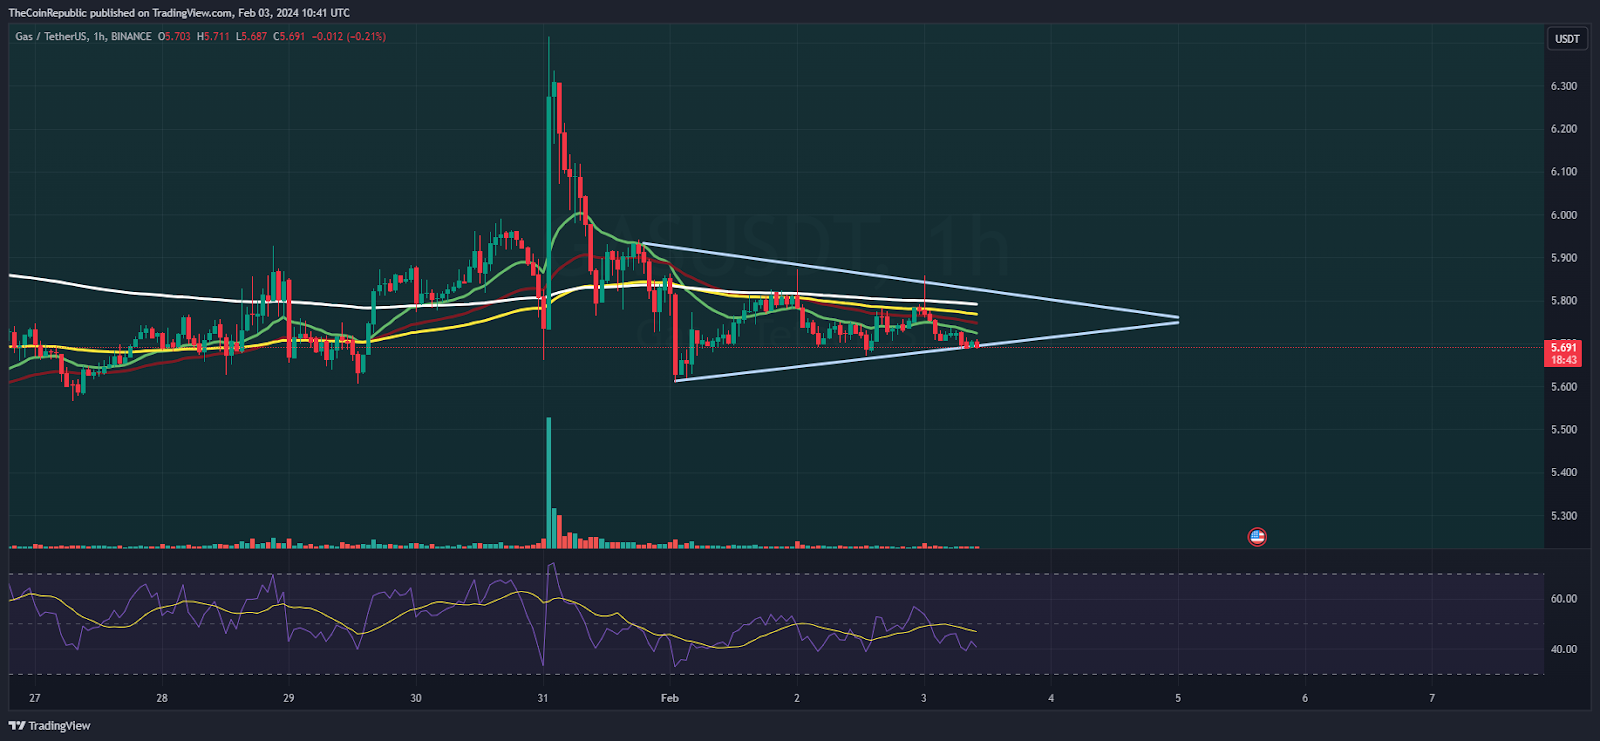
On the hourly charts, $GAS crypto forms a symmetrical triangle formation, and the price is close to breaking the lower neckline of $5 and will soon register a breakdown. Additionally, the sellers have gained momentum and are ready to extend the fall below $5 in the coming sessions. Per the Fib levels, the token has breached the 38.2% zone and is on the verge of the 23.6% zone, which may be breached soon.
Summary
The $GAS token price signifies a bearish bias and retardation from the highs was noted, which reflects a negative outlook. Moreover, the token will continue to drag the gains and will go to the demand zone of $3 in the following sessions. The price action signifies lower lows and conveys bear dominance.
Technical Levels
Support Levels: $5 and $4.40
Resistance Levels: $6 and $6.40
Disclaimer
The views and opinions stated by the author or any other person named in this article are for informational purposes only and do not constitute financial, investment, or other advice. Investing in or trading crypto or stocks comes with a risk of financial loss.
Adarsh Singh is a true connoisseur of Defi and Blockchain technologies, who left his job at a “Big 4” multinational finance firm to pursue crypto and $NFT trading full-time. He has a strong background in finance, with MBA from a prestigious B-school. He delves deep into these innovative fields, unraveling their intricacies. Uncovering hidden gems, be it coins, tokens or NFTs, is his expertise. NFTs drive deep interest for him, and his creative analysis of NFTs opens up engaging narratives. He strives to bring decentralized digital assets accessible to the masses.