
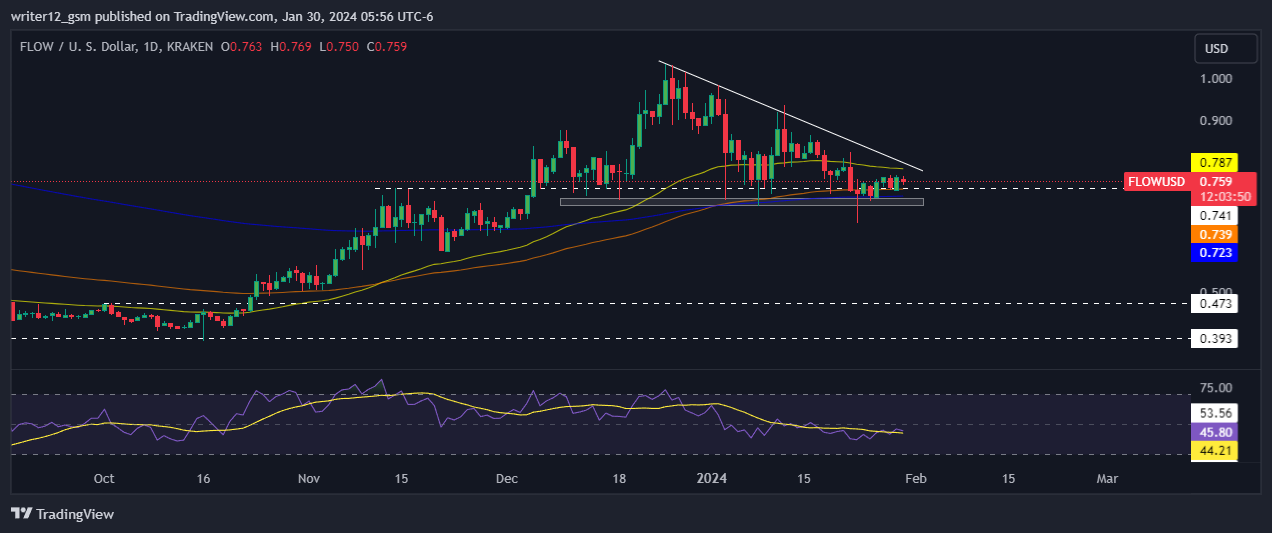
- 1 The $FLOW crypto price is currently trading at $0.757 with a drop of 1.43% in the last 24 hours with a current market cap of $1.12 Billion.
- 2 Technical indicators indicate the consolidation phase of the $FLOW crypto price.
- 3 The $FLOW crypto price has been consolidating inside the tight range of the daily time frame chart.
The $FLOW price analysis indicates that bears and bulls have not yet fully understood the trend. Investors may prefer to wait for multiple technical indicators to converge to determine the direction of the trend. The green candle is slightly increasing, indicating that the $FLOW price is attracting bulls in the support zone.
Investor sentiment on the $FLOW price is currently undecided and may remain negative unless bulls actively participate in price movements. However, given the technical indicators and price action, the price action is in favor of the bulls.
The price of the $FLOW cryptocurrency will attract bulls toward the upper trend line of the consolidation phase on the daily chart. Moreover, the $FLOW cryptocurrency price is trying to find support and surge towards the 20-day, 50-day, 100-day, and 200-day moving averages.
The $FLOW cryptocurrency is consolidating in a tight price range. Furthermore, the price of $FLOW cryptocurrency grew by about 2.17% in one week but fell by 15.19% in one month. Additionally, the price of the $FLOW cryptocurrency has risen approximately 44.17% over the past three months and approximately 30.68% over the past six months. Furthermore, the $FLOW cryptocurrency chart is showing a downward trend. However, analysts believe that the price of this cryptocurrency may rebound from low levels.
Technical Analysis of $FLOW Crypto Price
 $FLOW Price Analysis: Will $FLOW Price Be Able to Break Consolidation?">
To reach the upper level of the consolidation phase, the price of the $FLOW cryptocurrency must begin to rise. Moreover, for the $FLOW cryptocurrency needs to accumulate buyers to enter the recovery phase.
The price of the $FLOW cryptocurrency fell below the 20-day, 50-day, 100-day, and 200-day moving averages. It should register a breakout during the consolidation phase on the daily chart.
The $FLOW cryptocurrency price grew 2.85% in a week and 14.62% in a month. Additionally, the price has fallen by about 14.62% over the past months and grew by about 31.54% over the past six months.
Technical indicators showcase a consolidation phase in the price of the $FLOW cryptocurrency. The Relative Strength Index shows the sideways trend of the crypto. The RSI was at 46.05 and moving towards oversold territory.
MACD also shows the consolidation phase of the price of $FLOW crypto. The MACD curve is positioned above the signal line and waits for any type of crossover. $FLOW cryptocurrency investors should wait for a change in direction on the daily chart.
Summary
On the daily chart, the price of the $FLOW cryptocurrency was consolidating in a horizontal price range. However, to surge towards the recovery phase, the crypto needs to accumulate more buyers. Technical indicators indicate a period of price consolidation for the crypto. $FLOW cryptocurrency investors should monitor directional changes on the daily charts. Moreover, investors and traders must stay to be properly prepared for the next step and avoid FOMO.
Technical Levels
Support Level: The most immediate support level for the $FLOW crypto price is $0.723.
Resistance level: The most immediate resistance level for the $FLOW crypto price is $0.787.
Disclaimer
The analysis provided in this article is for informational and educational purposes only. Do not rely on this information as financial, investment, or trading advice. Investing and trading in crypto involves risk. Please assess your situation and risk tolerance before making any investment decisions.
With a background in journalism, Ritika Sharma has worked with many reputed media firms focusing on general news such as politics and crime. She joined The Coin Republic as a reporter for crypto, and found a great passion for cryptocurrency, Web3, NFTs and other digital assets. She spends a lot of time researching and delving deeper into these concepts around the clock, and is a strong advocate for women in STEM.