- 1 REN token slides from the top of $0.091100 and is revealing retracement.
- 2 Buyers are losing their strength and facing selling pressure.
The REN token signifies a downtrend and has faced selling pressure amidst market volatility over the past number of weeks. The price action represents the trendline breakdown, and the token has failed to sustain gains on the 200-Day EMA and is indicating bearishness. The token is now consolidating below the 20-Day EMA support zone and is forming lower lows.
REN price slipped below the significant moving averages, directing a bearish bias and suggesting a further down move. If the token scratches above the 20-Day EMA mark, it may rise to $0.05800, whereas if rejected from $0.05600, it will slip to $0.05300. Per the Fibonacci retracement levels, the REN price fell below the 38.2% zone and is heading to the 23.6% zone.
This cryptocurrency’s price was $0.055624 at press time, with an intraday gain of 2.57%, showing selling pressure. Moreover, the trading volume increased by 9.28% to $5.11 Million, highlighting volatility. The pair of REN/BTC was noted at 0.00000131 BTC, while the market cap is $33.46 Million. Analysts are neutral and suggest that the token will drag toward the demand zone of $0.05000 in the following sessions.
REN On Daily Chart Displays Distribution
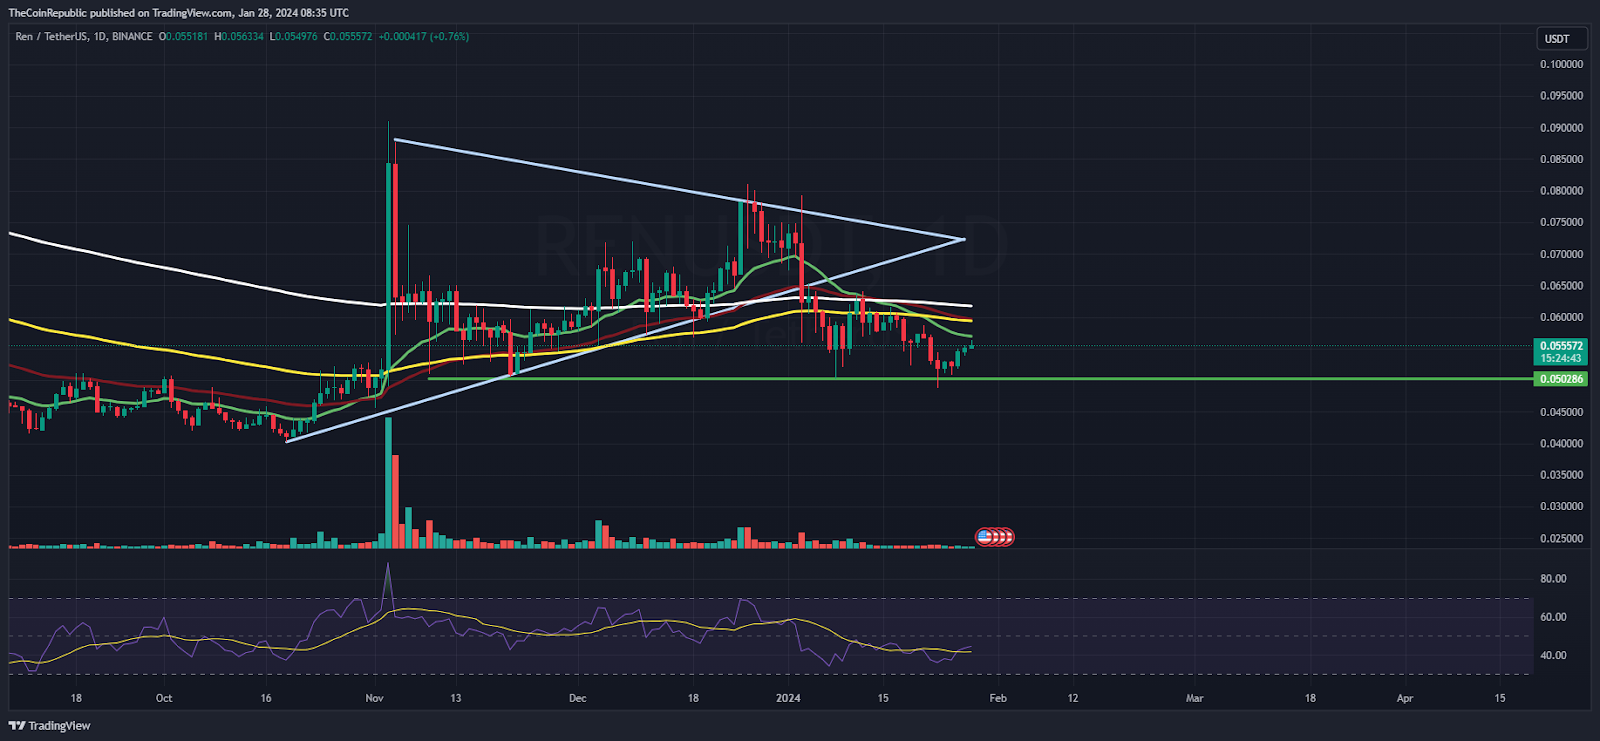
On the daily charts, the REN price cracked the trendline support zone of $0.0600 and slipped to the bearish trajectory. Furthermore, the price action shows that bulls have managed to halt the gains and are retesting the 20-Day EMA mark. If a rejection candlestick is formed, the token will continue to drag gains in the following sessions.
The relative strength curve stayed in the oversold region, depicting a negative crossover indicating the selling momentum for the past session. The MACD indicator shows a bearish crossover and suggests a continuation of bearishness amidst the downtrend.
REN On Weekly Chart Reflects Rejection From 50-Day EMA
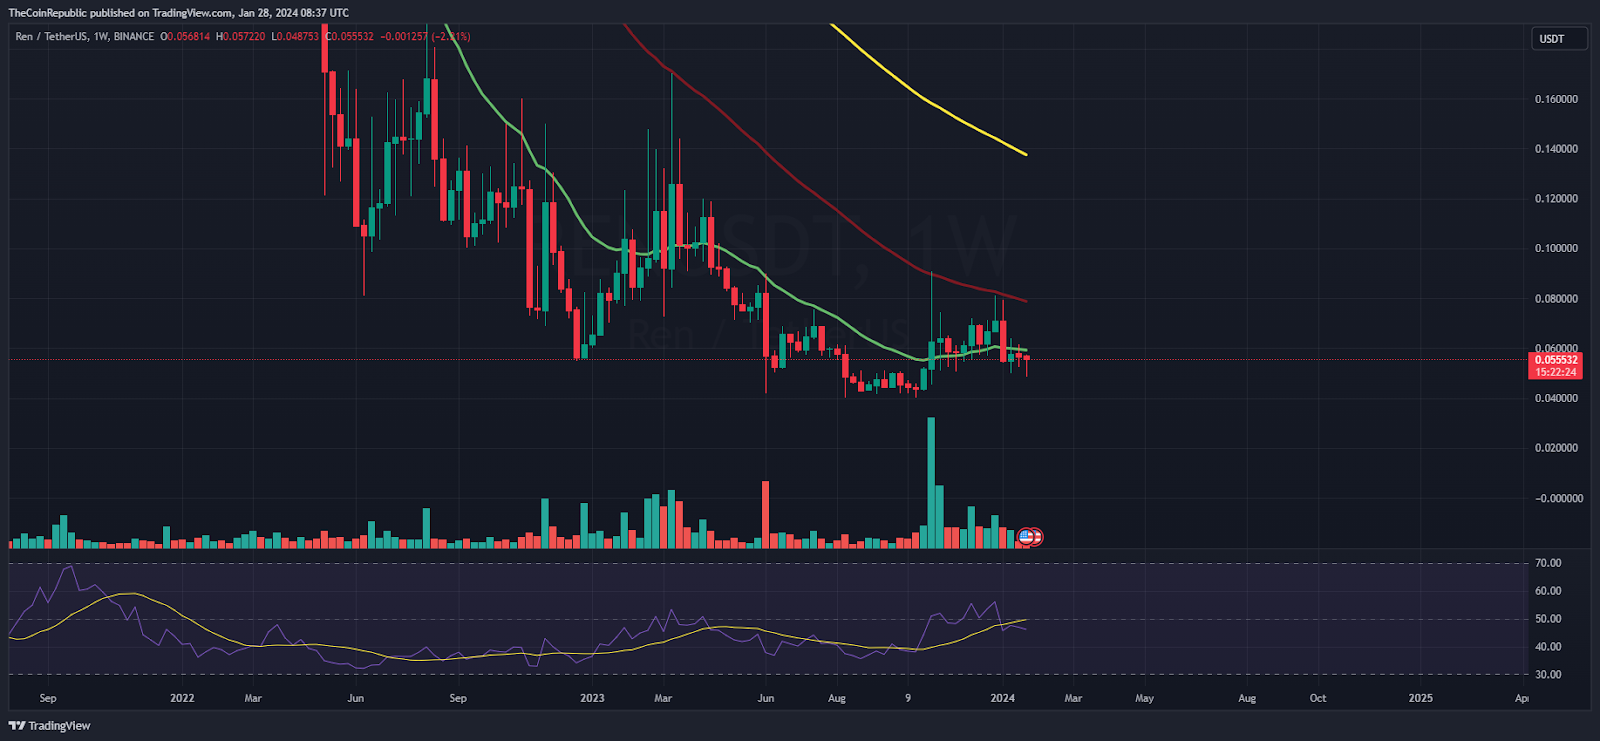
On the weekly charts, the REN token price faced multiple time rejections from the 50-Day EMA mark and is hovering close to the 20-Day EMA mark, unveiling a downtrend. Moreover, the trend favors bears, and the token may continue to face a selloff and retest the demand zone of $0.05000 in the following sessions.
Summary
REN token price showcased a breakdown and slipped below the key moving averages, revealing seller strength. Moreover, the price action conveys the lower low swings and reflects a downtrend for the past sessions. Meanwhile, the token is near its demand zone and may attain a pullback soon.
Technical Levels
Support Levels: $0.05400 and $0.05200
Resistance Levels: $0.05700 and $0.06000
Disclaimer
The views and opinions stated by the author or any other person named in this article are for informational purposes only and do not constitute financial, investment, or other advice. Investing in or trading crypto or stocks comes with a risk of financial loss.
Anurag is working as a fundamental writer for The Coin Republic since 2021. He likes to exercise his curious muscles and research deep into a topic. Though he covers various aspects of the crypto industry, he is quite passionate about the Web3, NFTs, Gaming, and Metaverse, and envisions them as the future of the (digital) economy. A reader & writer at heart, he calls himself an “average guitar player” and a fun footballer.