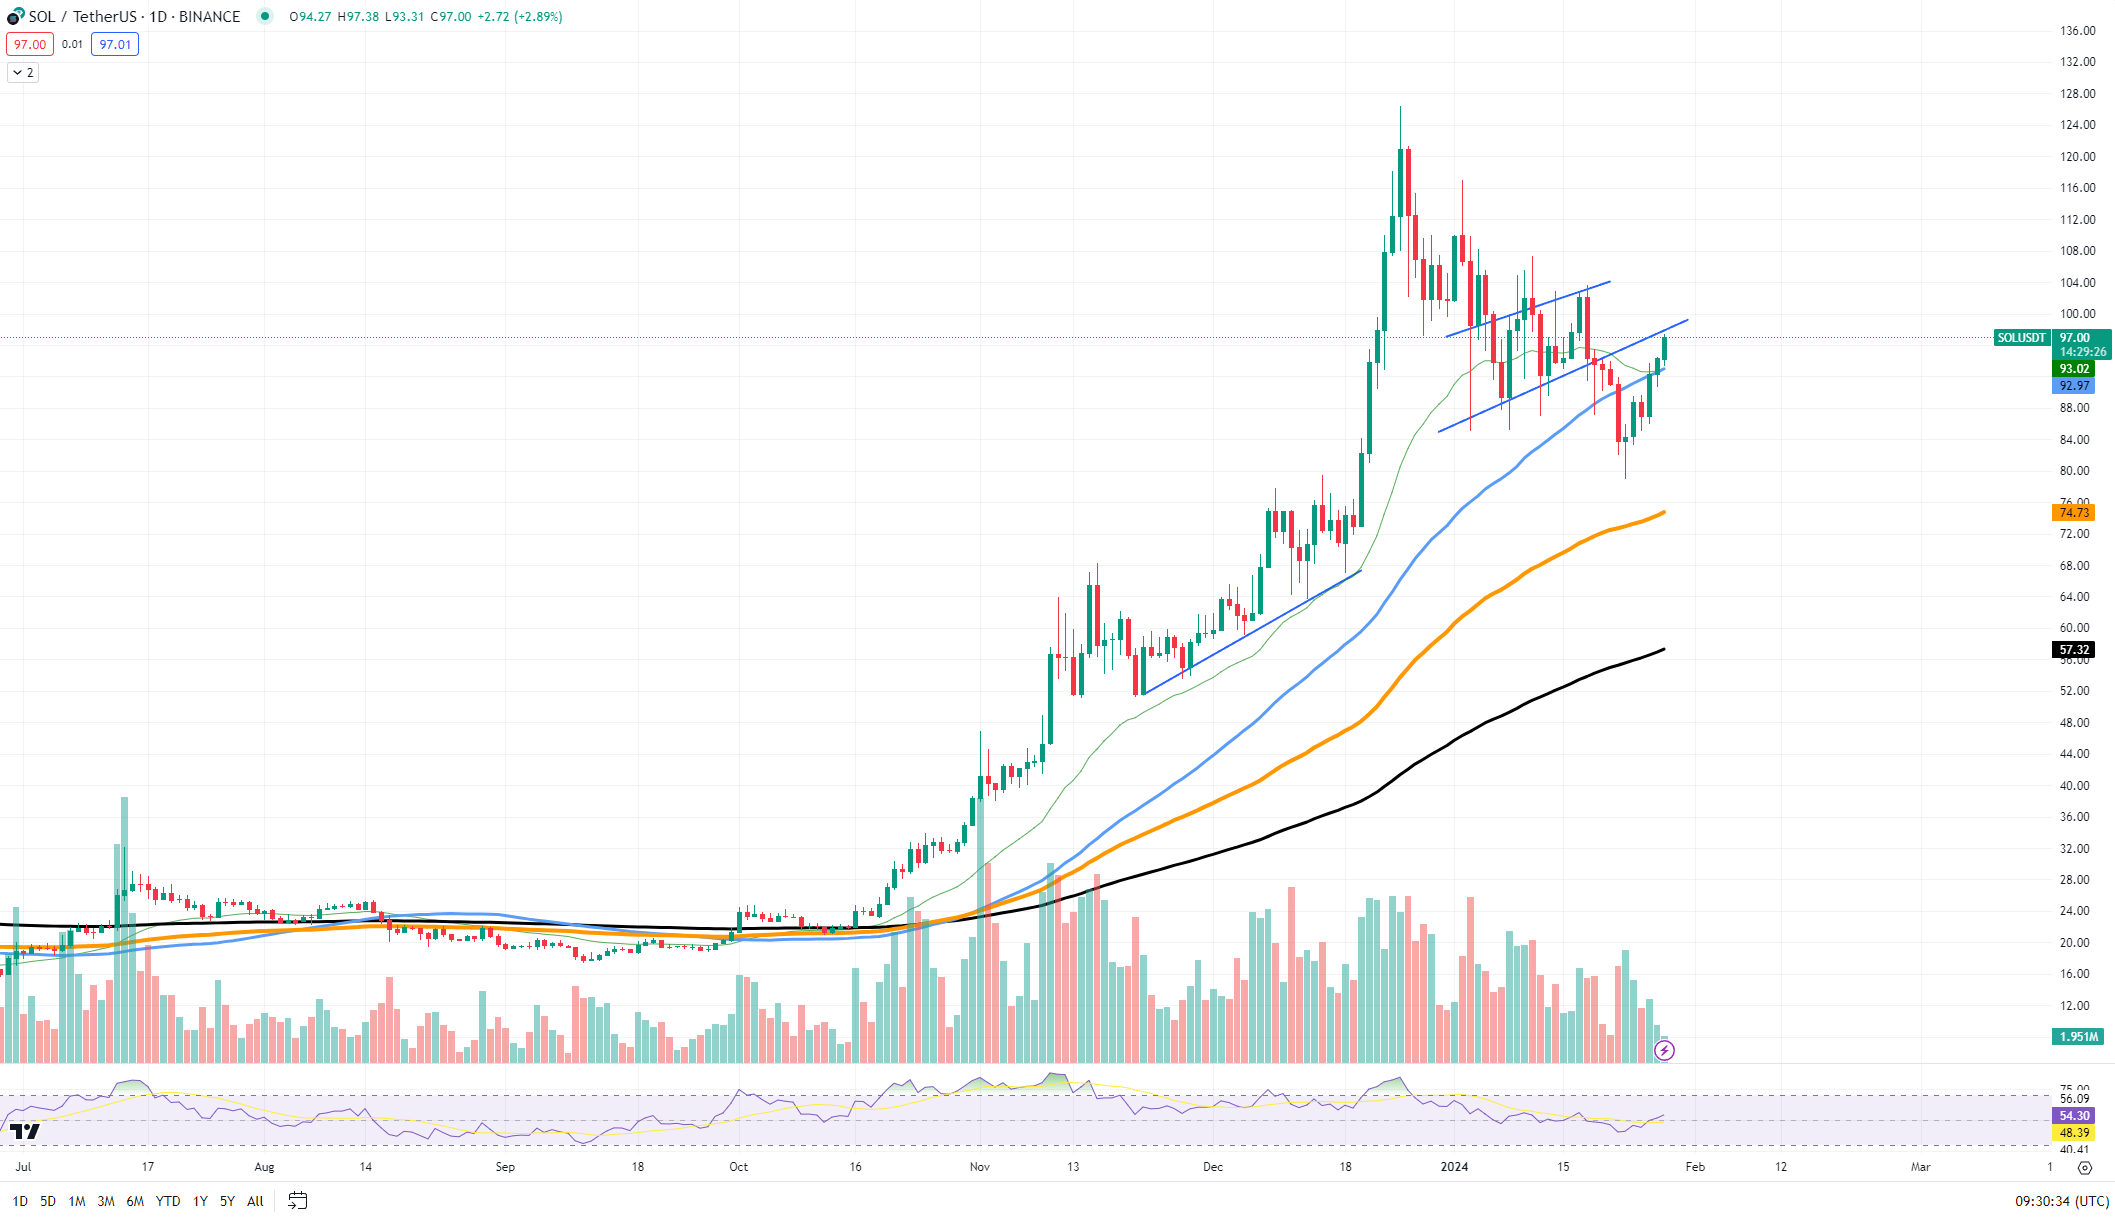
The Solana daily chart shows us that the price is finally recovering from a recent downtrend, with a series of higher lows forming a tentative ascending channel. The local support level can be identified around the $74.73 mark, which aligns with the recent low points and a dynamic support line that has been respected in the recent price action. On the upside, the resistance is near the $99.59 level, which coincides with the recent peaks forming a potential resistance zone.
If the price continues to respect the ascending trend line, we could anticipate a bullish scenario where SOL/USDT targets the upper boundary of the current channel. A decisive breakout above the $99.59 resistance level could lead to a retest of the psychological $100 mark, potentially extending gains toward the next significant resistance near $110.

Conversely, if the price breaks below the support at $74.73, this could invalidate the bullish outlook and signal a bearish scenario. A sustained move below this support might trigger a decline toward the $57.32 level, which represents a stronger historical support level. Further weakness could see the price challenging the $50 zone, a substantial psychological and technical support level.
Crucial pattern
The pattern that stands out is an inverse double bottom, indicated by two distinct troughs that suggest a reversal from the preceding downward trend. The neckline of this pattern lies around the 0.04243 ETH level.
A confirmed breakout above this neckline could project a target by measuring the distance from the neckline to the bottom of the troughs and extending that distance above the neckline.
The inverse double bottom pattern is typically a bullish reversal signal, suggesting that if SOL breaks above the neckline with conviction, we could see a rally in the SOL/ETH pair.
 u.today