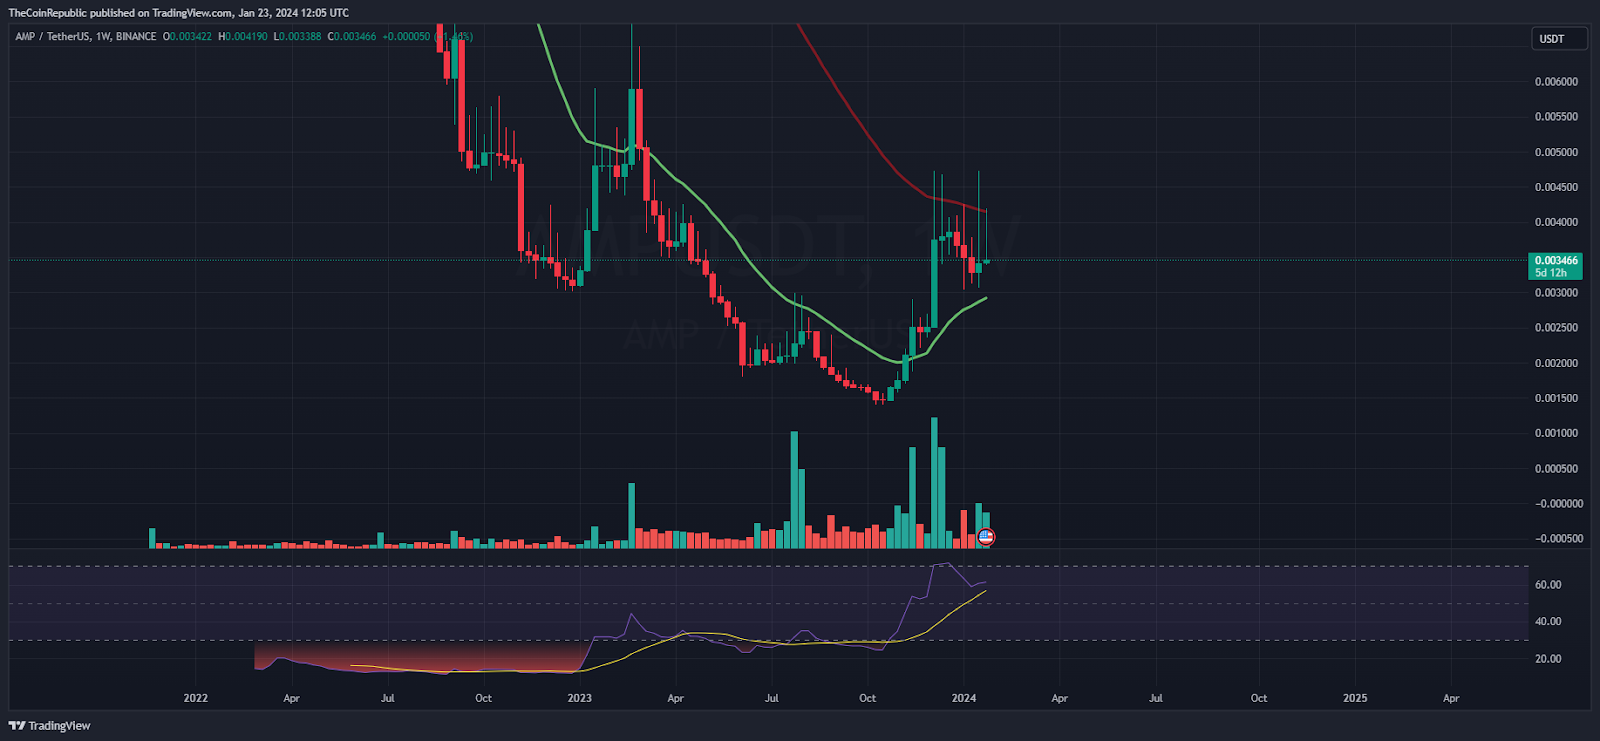
- 1 AMP token depicts a triple top formation and its support zone of $0.003400.
- 2 Buyers are trying to sustain gains above the trendline support of $0.003000.
The AMP token reveals multiple rejections from the hurdle of $0.004350 and bulls faced throwback in the recent sessions. Moreover, the token forms an inside bearish candlestick and is hovering near the 20-day EMA, delivering indecisiveness. However, the trendline is still not breached and the trend is neutral. If the token slips below $0.003000, then a fresh selloff may trigger and AMP price may retest the lows of $0.002500 in the next sessions.
The AMP token price is trading near the crucial range between $0.003200 – $0.003500, which is the no-trade zone. If the token price surpasses the range, it will attain momentum and will reflect investors’ interest. The price action showcased the rejection from the top and support at the bottom, which means the range-bound movements.
This cryptocurrency’s price was $0.003400 at press time, with an intraday drop of 11.30%, showing a bearish outlook. Moreover, the trading volume increased by 61.80% to $18.04 Million, highlighting rejection. The pair of AMP/BTC was noted at 0.0000000877 BTC, while the market cap is $303.86 million. Analysts are neutral and suggest that the token will showcase volatility in the upcoming sessions.
AMP On Daily Charts Reflects Rejection from Top

On the daily charts, AMP price has formed higher high swings in the past session and reached the major hurdle of $0.004500. Afterward, the token tried multiple times to escape the region but did not succeed. Moreover, a long rejection wick displays strong control of sellers near the top. Besides, buyers need more strength to control the gains amid the market volatility.
The relative strength index (RSI) curve has stayed near 50, showing a neutral outlook and forming a positive crossover. The MACD indicator shows a convergence of the MA line with the signal line, revealing the indecisiveness between the bulls and bears.
AMP On Weekly Charts Reflects

On the weekly charts, the AMP crypto price was in a downtrend and revealed a rebound in the recent sessions. However, the token faced rejection near the 50-day EMA mark and formed an inverted hammer candlestick, which exhibits the sellers’ dominance there. Per the Fib levels, the token failed to cross the 50% zone and is hovering near the 38.2% zone.
Summary
The AMP price formed an inverted hammer candlestick pattern and revealed rejection in the recent sessions. Moreover, the trend is neutral, and range-bound moves were witnessed amidst the volatile market. Furthermore, the bulls are trying to retain the gains above $0.003500 to gain strength.
Technical Levels
Support Levels: $0.003200 and $0.003000
Resistance Levels: $0.003600 and $0.003800
Disclaimer
The views and opinions stated by the author or any other person named in this article are for informational purposes only and do not constitute financial, investment, or other advice. Investing in or trading crypto or stocks comes with a risk of financial loss.
Nancy J. Allen is a crypto enthusiast, with a major in macroeconomics and minor in business statistics. She believes that cryptocurrencies inspire people to be their own banks, and step aside from traditional monetary exchange systems. She is also intrigued by blockchain technology and its functioning. She frequently researches, and posts content on the top altcoins, their theoretical working principles and technical price predictions.
 thecoinrepublic.com
