Horizen (ZEN) has broken down from a pattern that previously was in place since July. In order for the upward movement to continue in the long-term, it is imperative that ZEN bounces at the current price level.
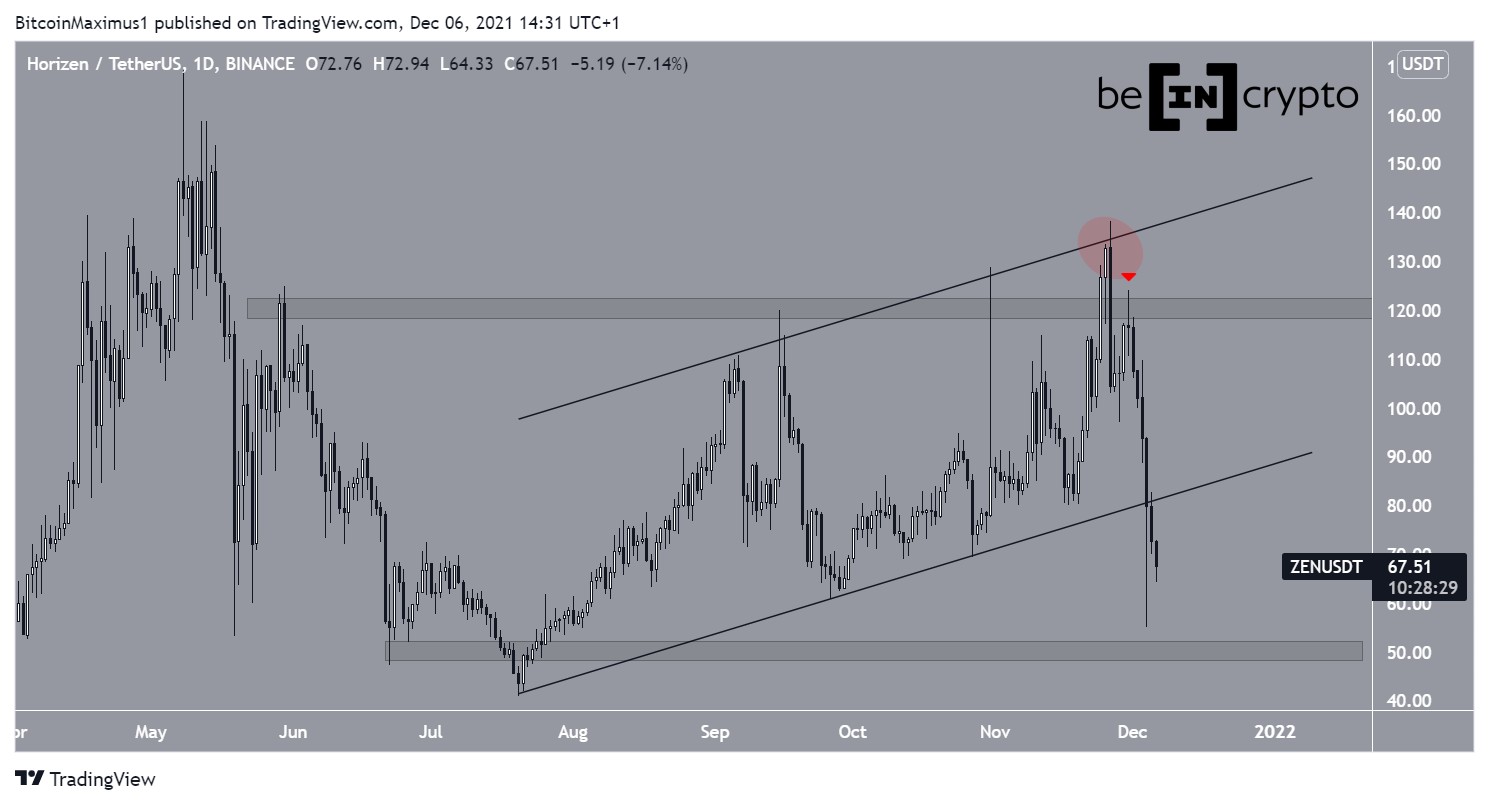
ZEN had been increasing since July 20, trading inside an ascending parallel channel. The pattern led to a high of $138.31 on Nov 26. At the time, it seemed like the token had also broken out from the $120 resistance area.
However, the token fell shortly afterwards and validated the $120 area as resistance once more (red icon).
More importantly, ZEN broke down from the channel on Dec 4, suggesting that the previous upward movement had come to an end.
If the downward movement continues, the closest support area is at $50, created by the July lows.
Current bounce
Cryptocurrency trader @TradingTank outlined a ZEN chart, stating that the token could soon bounce at support and continue higher.
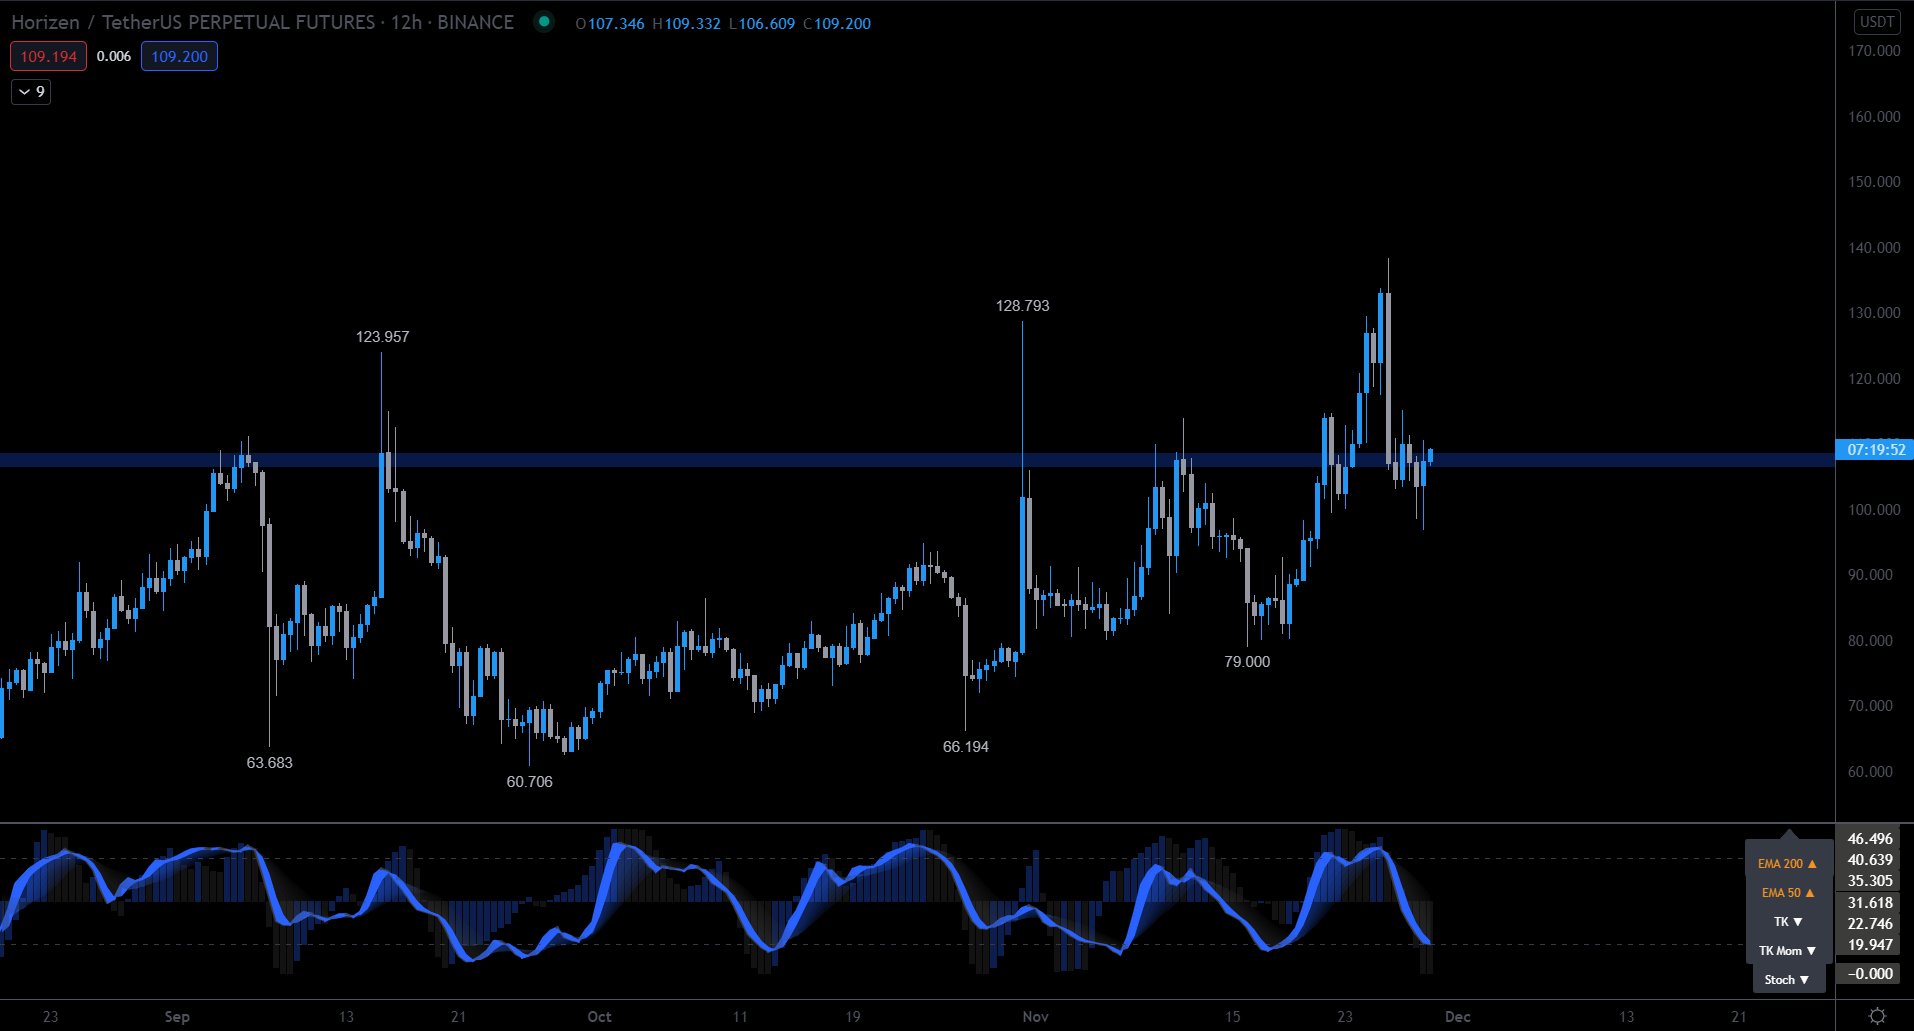
Since the tweet, the token has fallen below the support line.
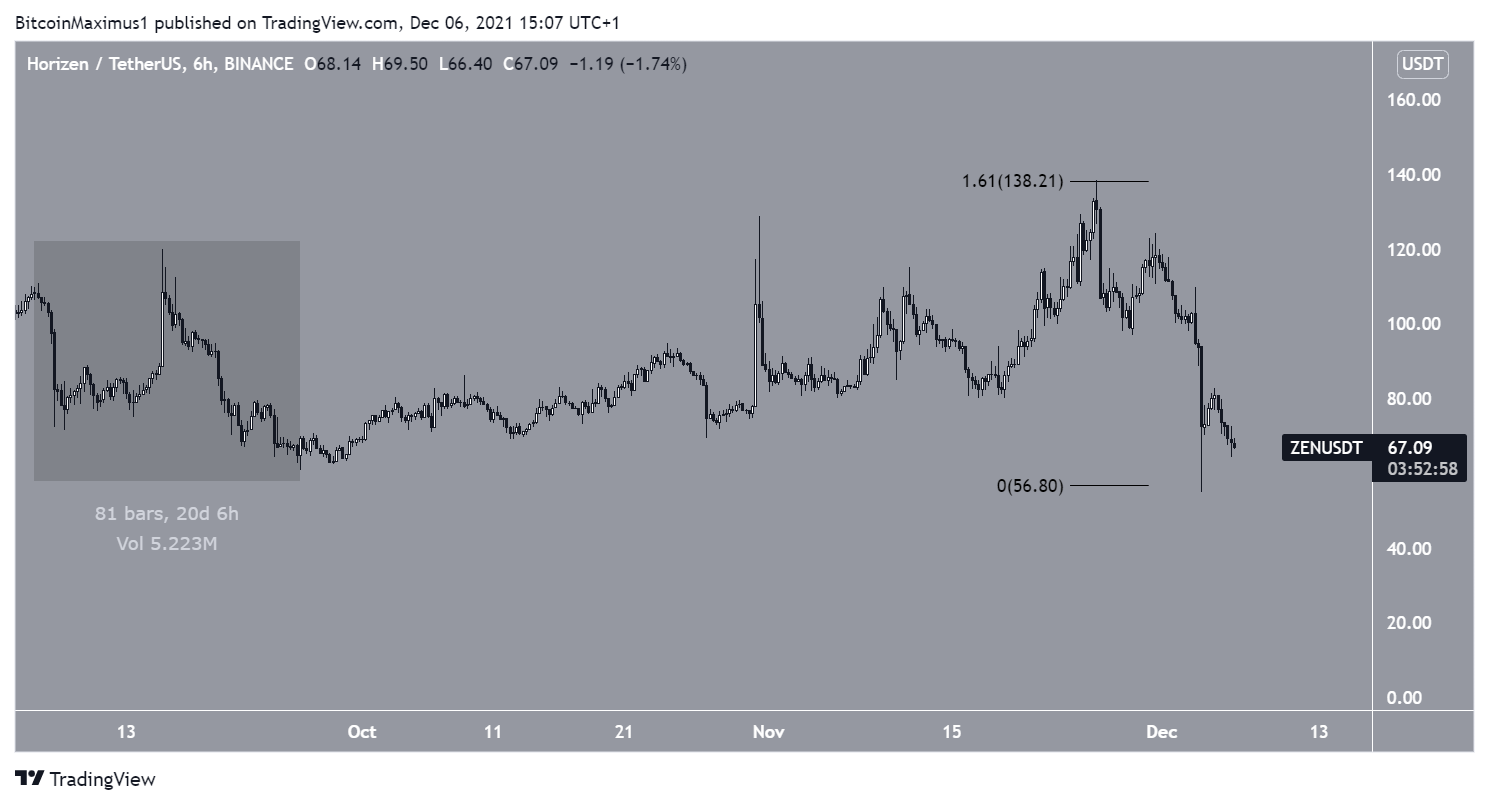
However, there is an interesting similarity between the previous drop, that transpired on Sept (highlighted), and the current one.
If the token were to have reached a low, the current decrease would have a magnitude of exactly 1.61 that of the Sept drop. This is a very common ratio.
However, in order for it to hold, it is crucial that ZEN does not reach yet another low.
Future ZEN movement
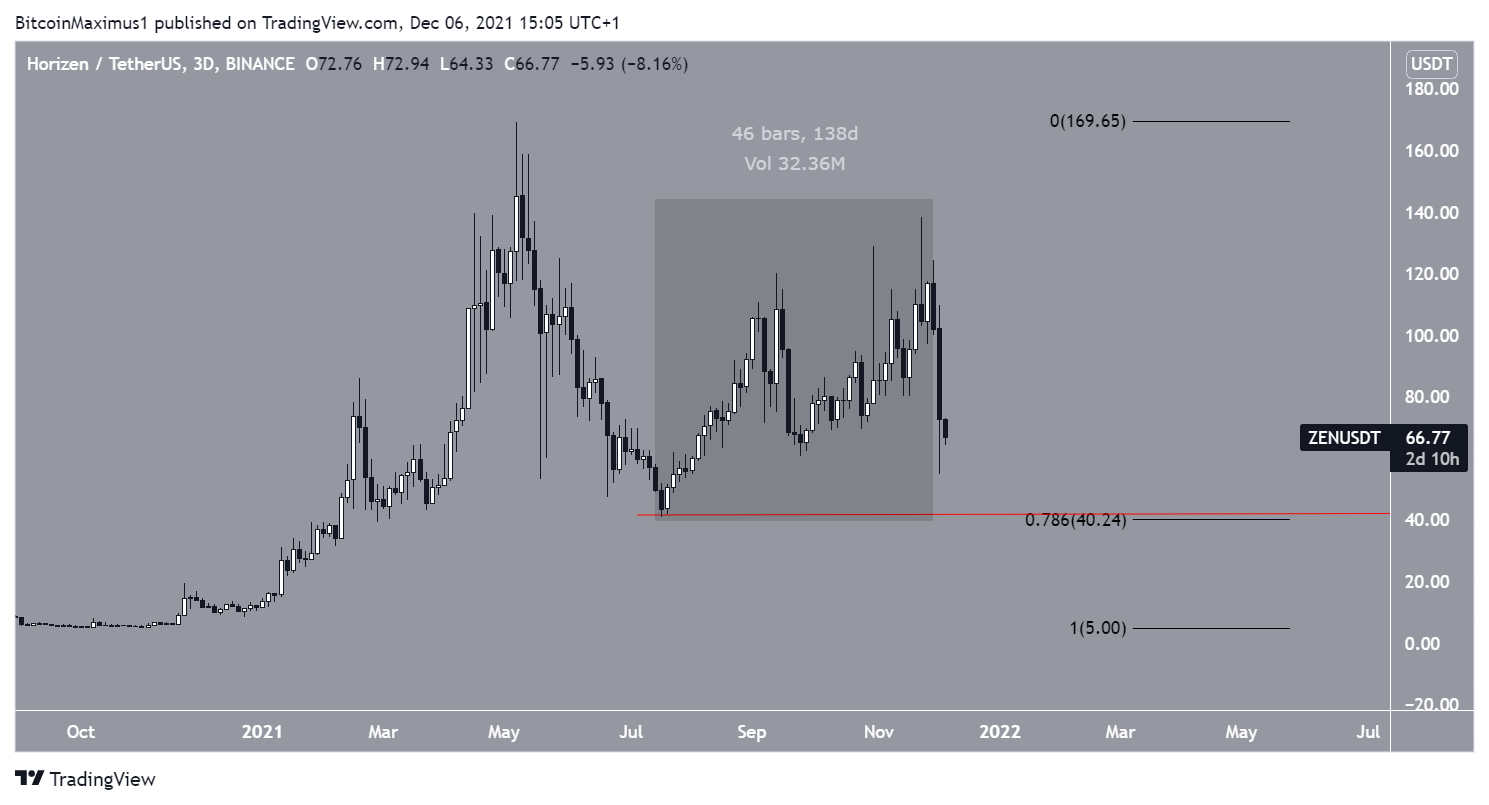
In order for the upward movement to continue, it is very important a bounce at the current level transpires.
If not, the entire upward movement since July (highlighted) would be considered corrective.
In that case, ZEN would fall and sweep the July 20 lows (red line), and potentially decrease lower.