Shiba Inu is witnessing substantial transactional activity with billions of tokens being deposited onto major exchanges. This movement of large quantities often hints at potential liquidity events or preparatory steps for significant market actions.
From the transaction data, we observe substantial quantities of SHIB being transferred to exchanges like Upbit, Binance and Crypto.com. Notably, a single transaction to Upbit involved an impressive 52 billion SHIB valued at approximately $505,640. Such substantial moves to exchange wallets can sometimes indicate a readiness to sell, as investors look to capitalize on recent price movements or mitigate risks of a downturn.

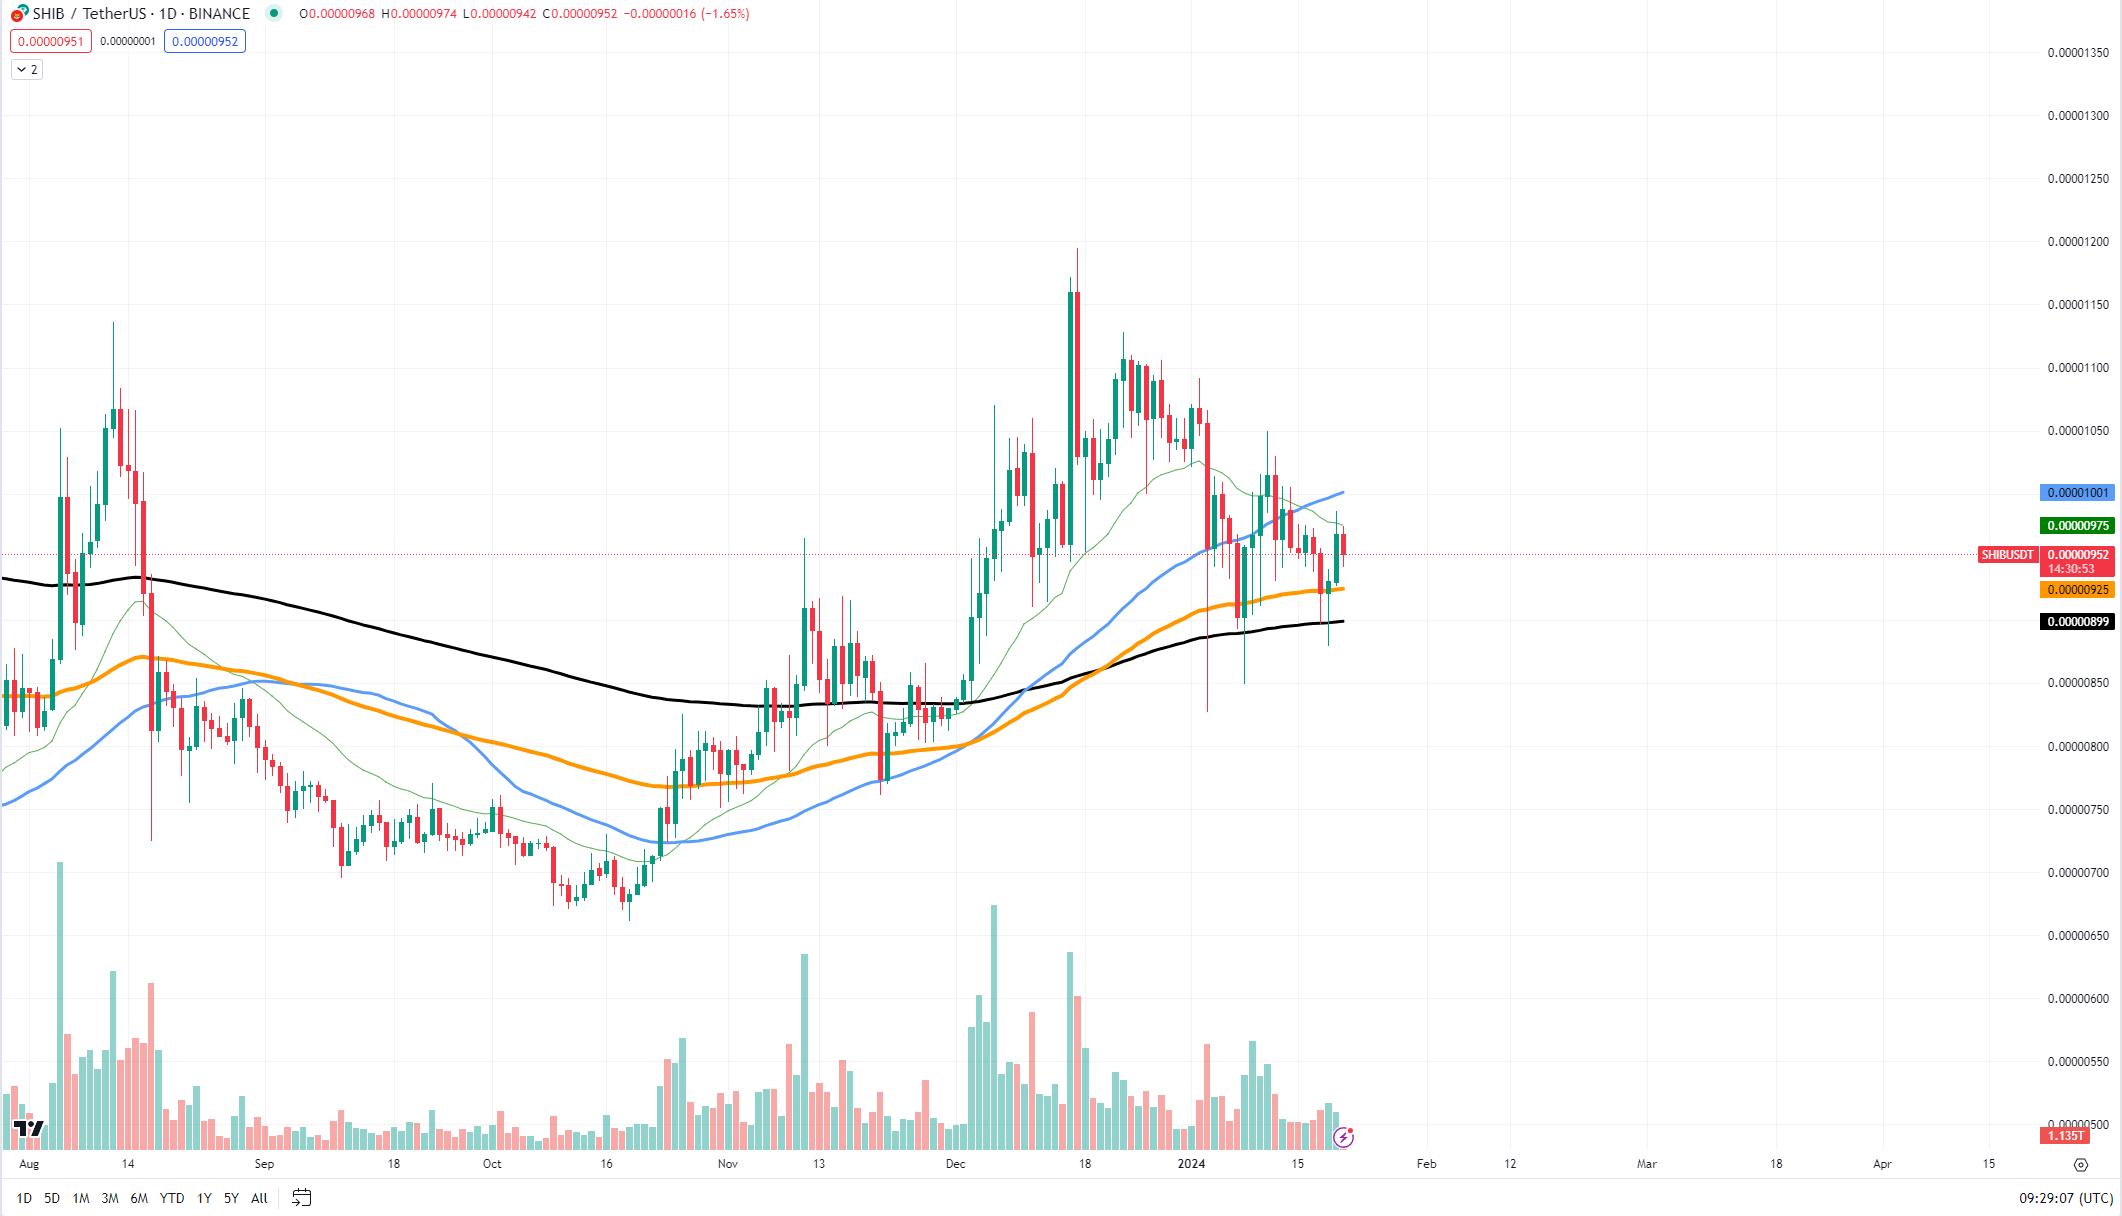
Analyzing the Shiba Inu price chart, we identify a series of peaks and troughs, forming what appears to be a tightening consolidation pattern. This compression signals a period of indecision among traders, with a breakout likely to dictate the next significant price trend for SHIB.
The chart shows resistance forming around the upper trendline of the current price pattern, where SHIB has experienced pushback, creating a temporary ceiling. On the flip side, the support level is where the price has found a floor, with the lower trendline providing a boundary that bulls have defended successfully so far.
A comprehensive analysis suggests that if the influx of SHIB to exchanges results in increased selling pressure, and the support level breaks, we could witness downward price action. Conversely, should the resistance be breached with sufficient volume and buying pressure, an upward trend may ensue.
Considering the current market dynamics and whale activity, traders and investors in SHIB should closely monitor these key support and resistance levels for early signs of a decisive market move.
 u.today