- The PancakeSwap price analysis is Bullish today.
- Resistance is found at $12.5.
- Support for CAKE/USD is present at $10.2.
The Pancaleswap price analysis favors bulls for today as it has recovered to $11.6 after being on a downtrend for long. CAKE/USD has been on the decline since 8th November, and the past weeks have proved detrimental for CAKE’s price value as it has gone through extreme losses during this time. During the recent market drop, CAKE also reported a loss, but today, bulls have made some recovery and elevated the price notably.
CAKE/USD 1-day price chart: Bears sidelined as bulls made an entry
The 1-day price chart for Pancakeswap price analysis shows an increase in price as bulls covered an upwards range today after a continuous bearish slide. The price has now reached $11.6 at the time of writing after bullish efforts. A downtrend was observed for the past weeks as well, so the moving average (MA) is trading below the Bollinger bands average, and the volatility indicator now shows signs of slight convergence.
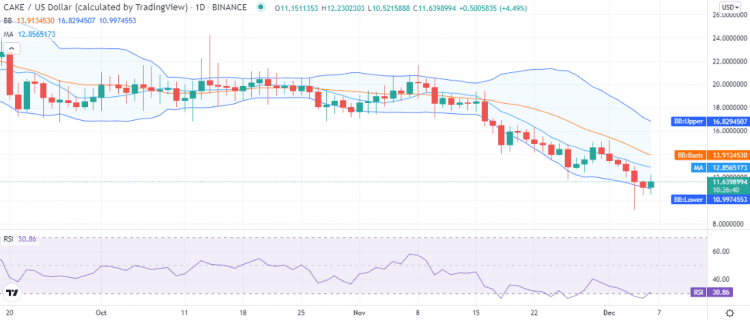
Also, both ends of the Bollinger bands are moving downwards, with the upper band at the $16.8 mark and the lower band is at the $10.99 representing support for CAKE. The average of the indicator is at the $13.9 mark representing resistance for CAKE/USD. The relative strength index (RSI) has improved a little bit as it has again appeared on the border of the neutral zone at index 30 after trading in the oversold zone for some time. The upwards RSI curve hints at the buying of assets in the market.
PancakeSwap price analysis: Recent developments and further technical indications
The 4-hour Pancakeswap price analysis shows the price breakout was upwards today, and it oscillated fast upwards during the first four hours. Thereon, CAKE corrected for four hours, and bullish efforts have again been observed in the last eight hours, but the momentum was low as the price oscillation was quite slow, and very small improvements have been made in this time. However, the direction has been bullish for today.
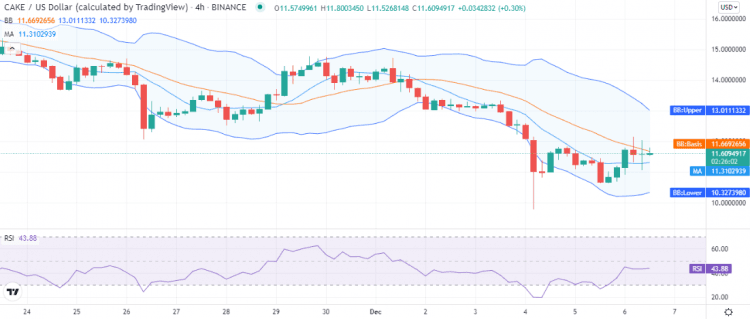
The MA is trading below the price level at the $11.3 mark, and the price is currently challenging the Bollinger bands average, which at $11.66 represents resistance for CAKE as the price is now settled at $11.60. The RSI is trading at a straight line after coming up sharply. However, the RSI score has improved on the 4-hour chart, which is now present at index 43.
As the major trend has been bearish for CAKE/USD for a long time, the technical indicators for Pancakeswap price analysis are also bearish as 14 technical indicators are favoring bears showing sell signs, and only three indicators are favoring bulls. The remaining nine indicators are neutral and do not favor any side of the market.
PancakeSwap price analysis conclusion
The Pancakeswap price analysis suggests the overall trend is still downwards despite today’s bullish efforts, as the recovery made is not enough to change the overall trend, but it can be a foundation stone for a trend reversal as the price has improved today. Currently, the price is present at the $11.6 level, which is in a resistance zone, and the CAKE is trading at a five-month low. We still expect CAKE to cover range upwards for the coming hours.
Disclaimer. The information provided is not trading advice. Cryptopolitan.com holds no liability for any investments made based on the information provided on this page. We strongly recommend independent research and/or consultation with a qualified professional before making any investment decisions.