Pseudonymous crypto analyst Altcoin Sherpa told his followers about his short-term view of Bitcoin (BTC), Ethereum Name Service (ENS), Sei (SEI), and Manta Network (MANTA) on January 20.
According to him, MANTA has a good potential to hit new highs because of its impressive Total Value Locked (TVL).
$MANTA: Aping into new coins is probably a decent idea for binance. this one has a decent amount of TVL but I wouldnt buy until the low $2s personally. pic.twitter.com/zMXaMQvfir
— Altcoin Sherpa (@AltcoinSherpa) January 20, 2024
MANTA/USD
Despite only launching a few days back, Manta’s TVL had increased to $427.03 million, DeFiLlama showed. This increase suggests that market participants seem to trust the protocol to give back a good yield.
However, Sherpa noted that it would be a good idea to buy MANTA when the price drops below $2. At press time, MANTA’s price was $2.29, thanks to a 7.47% increase in the last 24 hours.
Coin Edition looked at the MANTA/USD 2-hour chart and discovered it was still in the price discovery stage. So, it might be too early to conclude about its potential. However, this does not invalidate the analyst’s take that the TVL could play a part in its possible jump.
SEI/USD
Sherpa also assessed SEI’s price action. In the last 365 days, the price has increased by 8.285%. But the last 24 hours have seen the value decrease by 6.76%.
For the analyst, SEI might not be a token to buy in the short term. According to him, the price could rise to 0.50 Fibonacci retracement level. But he also opined that SEI might tap a lower level later.
$SEI: I feel confident the .50 area is coming.
— Altcoin Sherpa (@AltcoinSherpa) January 20, 2024
The reason is that the first .382 fib area around $0.58 already got tapped before and that had a strong reaction. That said, I think that we're going to eventually see lower levels. Not one to buy in the short term personally. pic.twitter.com/14oPBeANGc
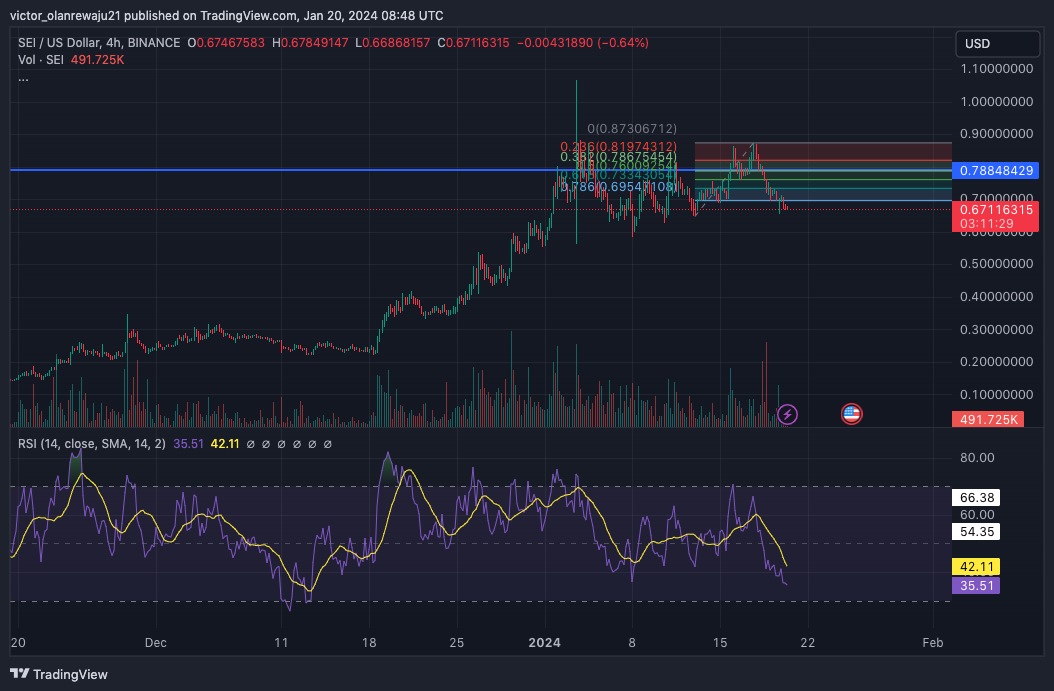
At press time, SEI’s structure was bearish, suggesting widespread profit-taking. A look at the 4-hour chart showed that 0.5 Fib level was at $0.78. Furthermore, the RSI was positioned at 35.56, indicating that the cryptocurrency might soon hit an oversold point.
Should the RSI reading drop to 30.00, SEI’s price could reverse to the upside. Also, this could be the point where it aims to retest $0.78.

However, another round of profit-taking can occur at this point. If that happens, SEI might correct again, and possibly drop below $0.65.
ENS/USD
ENS has been going on a downward slope recently, This has caused its value to fall by 19.96% in the last seven days. Sherpa, however, noted that the price action could be its local bottom, and from the chart shared, the price could hits surpass $27 in the short term.
$ENS> Cut for a loss, didn't feel comfortable given the overall price action. Could still be the local bottom but I am not so sure. https://t.co/Qi2RKVyLHX pic.twitter.com/YwFTcdTQRt
— Altcoin Sherpa (@AltcoinSherpa) January 20, 2024
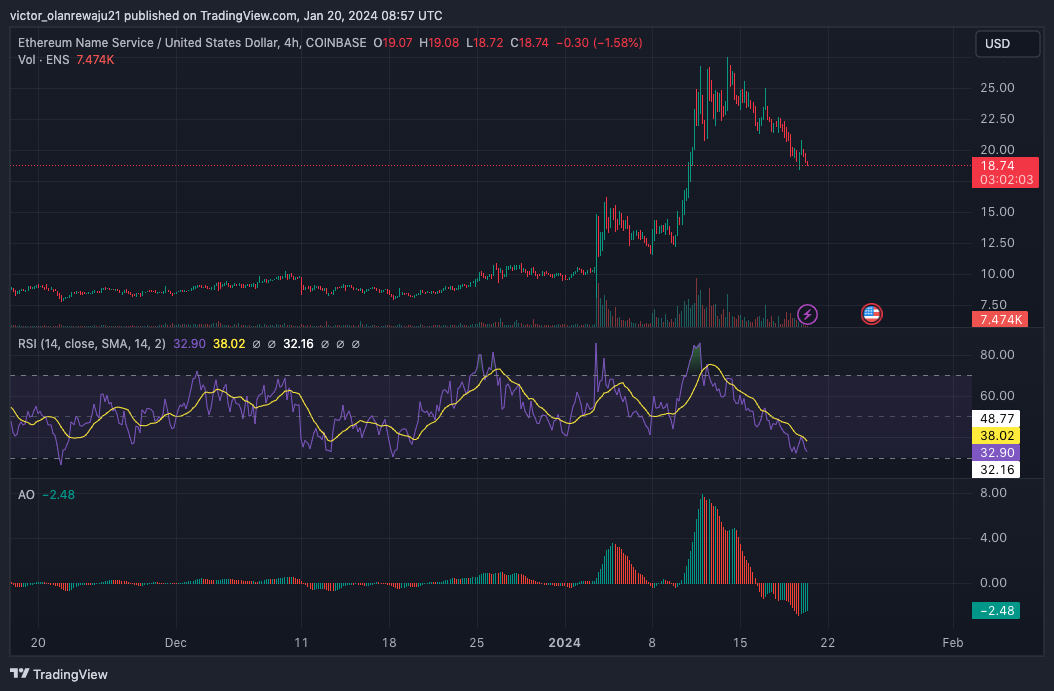
According to the 4-hour ENS/USD chart, sellers might soon be exhausted as the price approaches $18.50. Furthermore, indications from the RSI suggested the same.
An evaluation of the Awesome Oscillator (AO) revealed that the tides might soon change. Although the AO was negative, green histogram bars appeared. If the bars continue to remain green, it could lead the AO into the positive.
Should this be the case, ENS might experience an increasing upward momentum which could drive the value higher.

BTC/USD
In Altcoin Sherpa’s opinion, BTC might nosedive to $36,000. He backed up his point, noting that there was a lot of confluence around the 200-day EMA on the weekly chart.
He, however, mentioned that the 0.382 Fib level could serve as support for Bitcoin, which could later be a good region to open a long position.
$BTC this area is still support for now but the next area up would be 36k. lots of confluence w. 200d EMA, .382 fib/ support. Those make it a very easy long IMO. #Bitcoin pic.twitter.com/c09x2Fqrel
— Altcoin Sherpa (@AltcoinSherpa) January 20, 2024
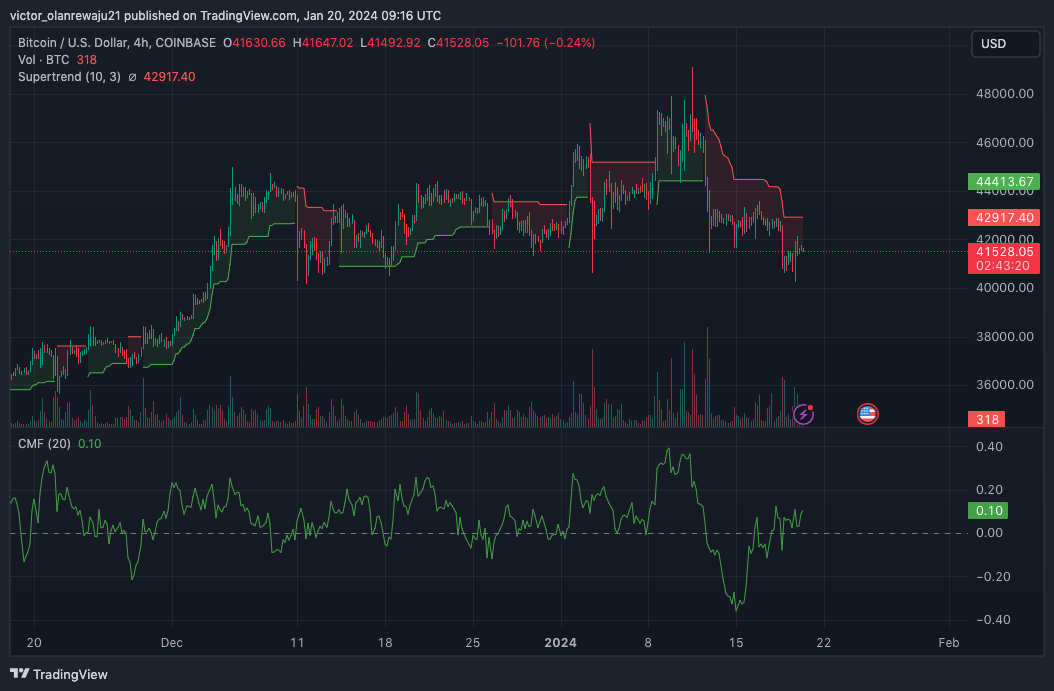
The analyst’s opinion seemed valid due to indications shown by the Supertrend. At press time, the Supertrend indicator was above BTC’s price.
This is considered a sell signal. If Bitcoin experiences more selling pressure from $41,524, then it might only take a short while before the price drops below $40,000.
However, the Chaikin Money Flow (CMF) had climbed into the positive region, suggesting an increase in buying pressure.

If the buying pressure continues to increase, BTC might resist falling. However, a downward move of the CMF could validate Sherpa’s opinion. But, a swift plunge to $36,000 seemed unlikely in the coming days.
Disclaimer: The information presented in this article is for informational and educational purposes only. The article does not constitute financial advice or advice of any kind. Coin Edition is not responsible for any losses incurred as a result of the utilization of content, products, or services mentioned. Readers are advised to exercise caution before taking any action related to the company.
 coinedition.com
