Markets have started slow, as seen from the global market cap, which has dropped by 0.37% from its previous 24-hour one, as the total cap stood at $1.68T as of press time. The fear and greed index is 63, as the greed index dominates.
Bitcoin Price Analysis
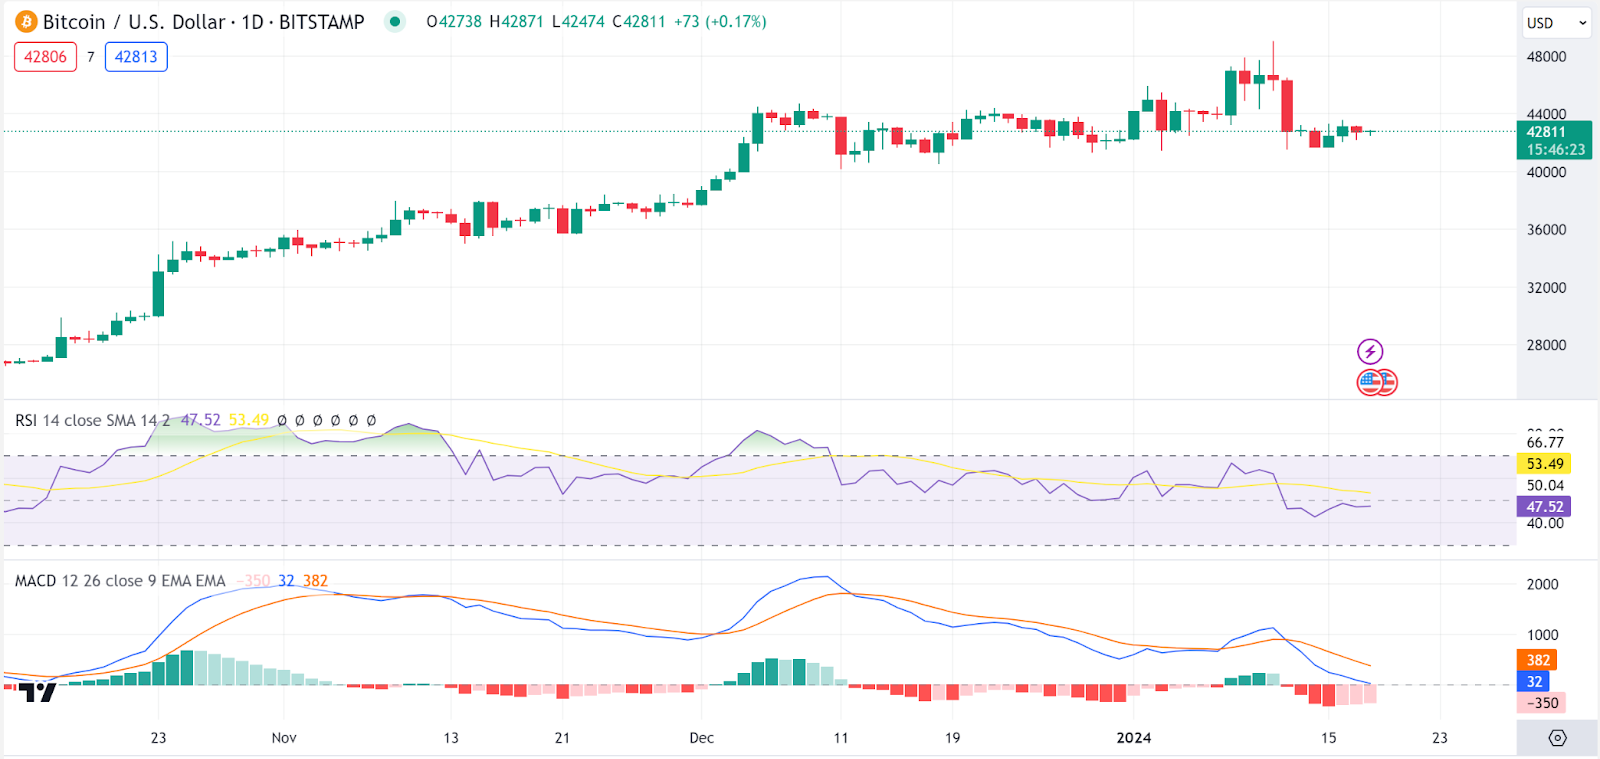
Bitcoin (BTC) has posted mild gains today as the Bitcoin price stood at $42.8K as of press time, representing a 0.6% pump in the last 24 hours to bring the weekly drop to 7%. Bitcoin’s trading volume has dropped by 15% over the same period to stand at $20.1B.
The future Bitcoin price trajectory now seems bullish, as an in-depth analysis of 24-hour BTC/USD charts reveals. The Relative Strength Index indicator now approves a cross over 50, showing building bull momentum on BTC. The MACD indicator, on the other hand, is reverting towards the red zone, showing fading bearishness as bulls now take effect on the Bitcoin price.
Ethereum Price Analysis
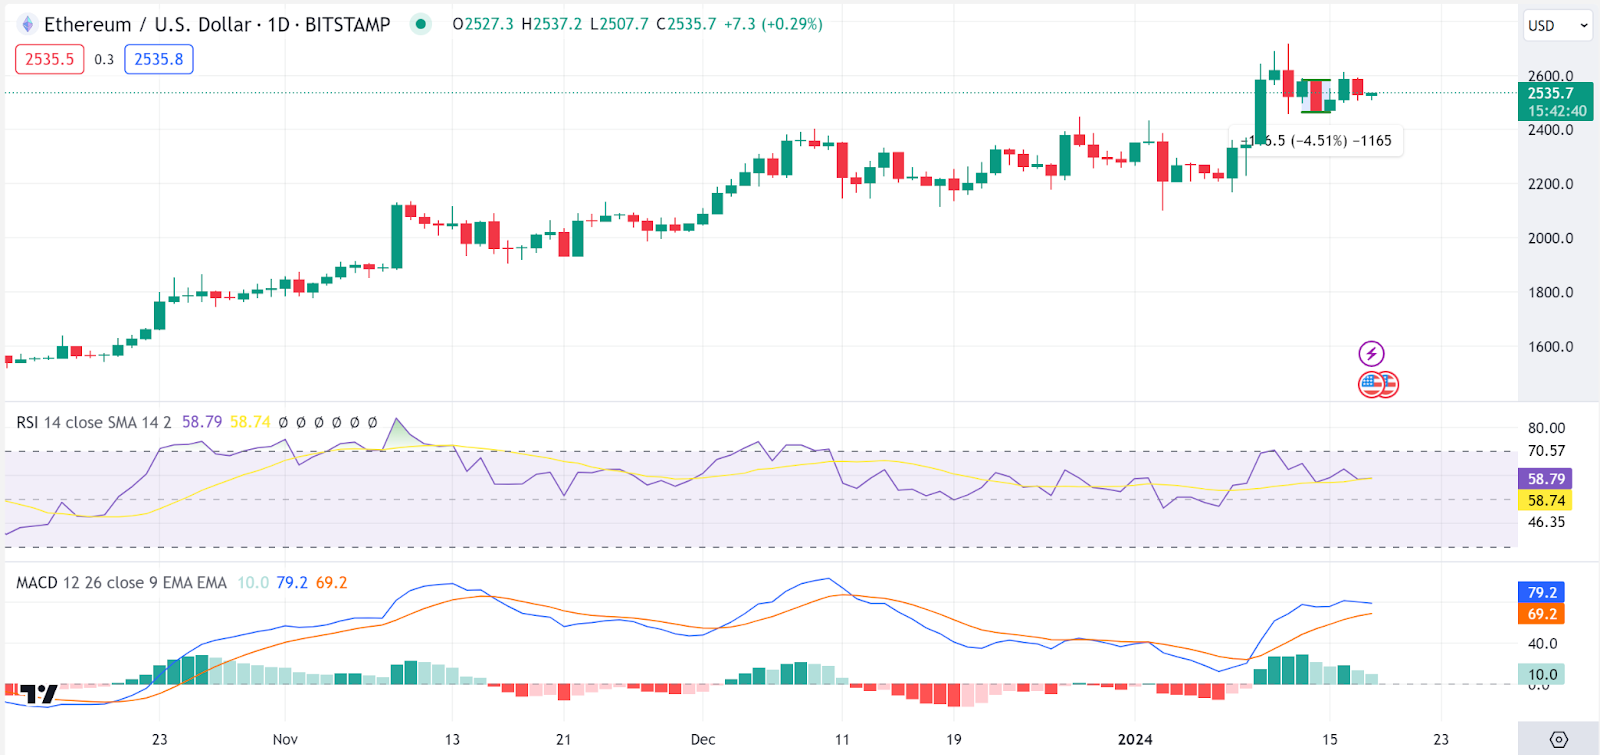
However, Ethereum (ETH) has failed to post gains today as the Ethereum price stood at $2535 as of press time, representing a 0.3% increase in the last 24 hours as the weekly rise stood at 10%. The trading volume has dropped by 10% to $10.1B.
An in-depth analysis of the ETH/USD charts also shows that bulls and bears struggle to control ETH markets, as shown by the Relative Strength Index indicator, which is currently on a northern trajectory, showing bull pressure on the Ethereum price. On the other hand, the MACD indicator is reverting toward the red zone, showing bearish prospects on the Ethereum price.
Render Price Analysis
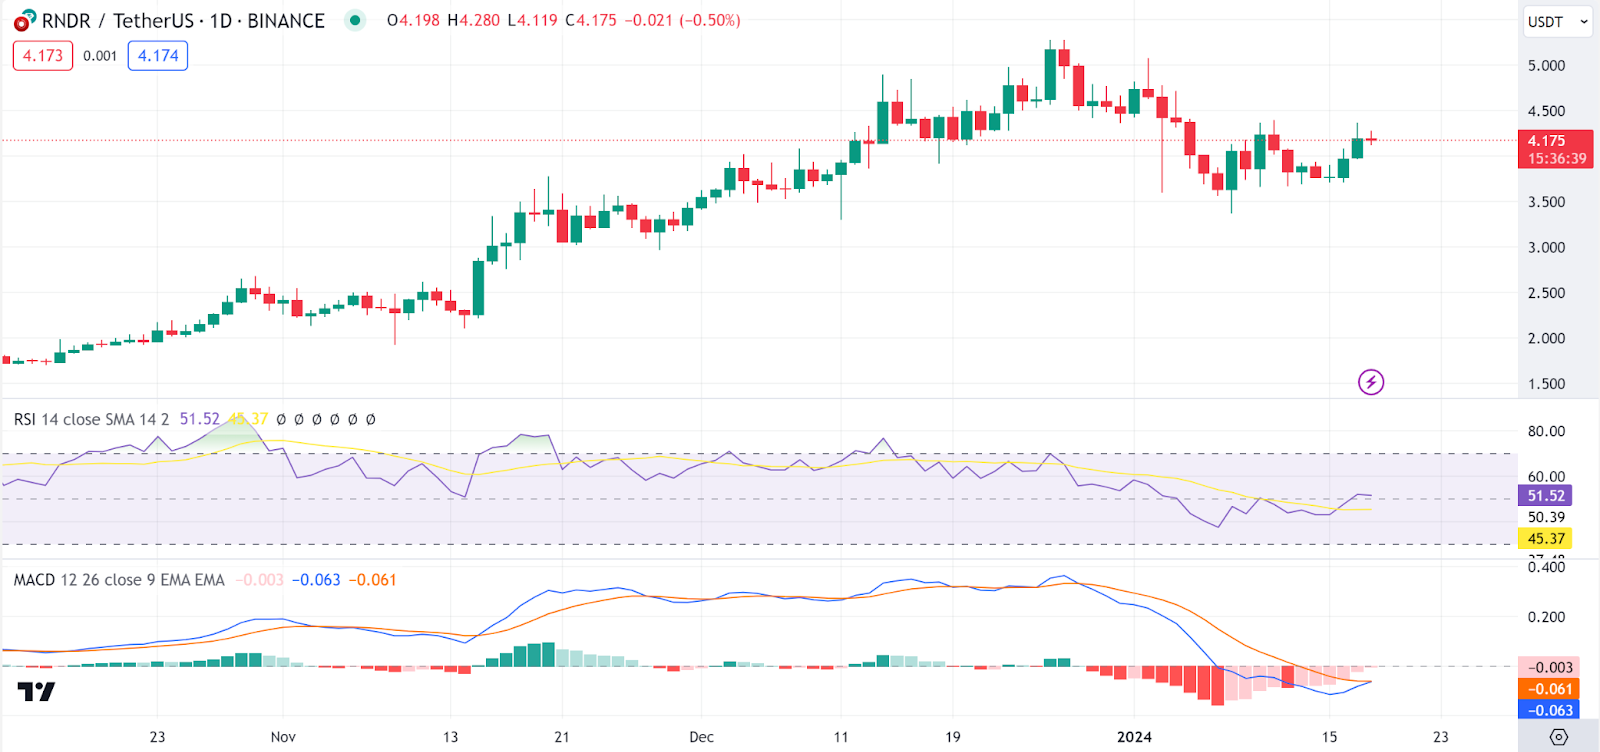
Render (RNDR) is among the gainers today as the Render price stood at $4.17 as of press time, representing a 2.9% increase in the last 24 hours to bring the weekly rise to 0.02%. The trading volume has jumped by 52% to $157M.
An in-depth analysis of the ETH/USD charts also shows that bulls control RNDR markets, as shown by the Relative Strength Index indicator, which is currently on a northern trajectory, having crossed above 50, showing bull pressure on the Render price. On the other hand, the MACD indicator is reverting toward the green zone, showing building bull momentum on the Render price.
Solana Price Analysis
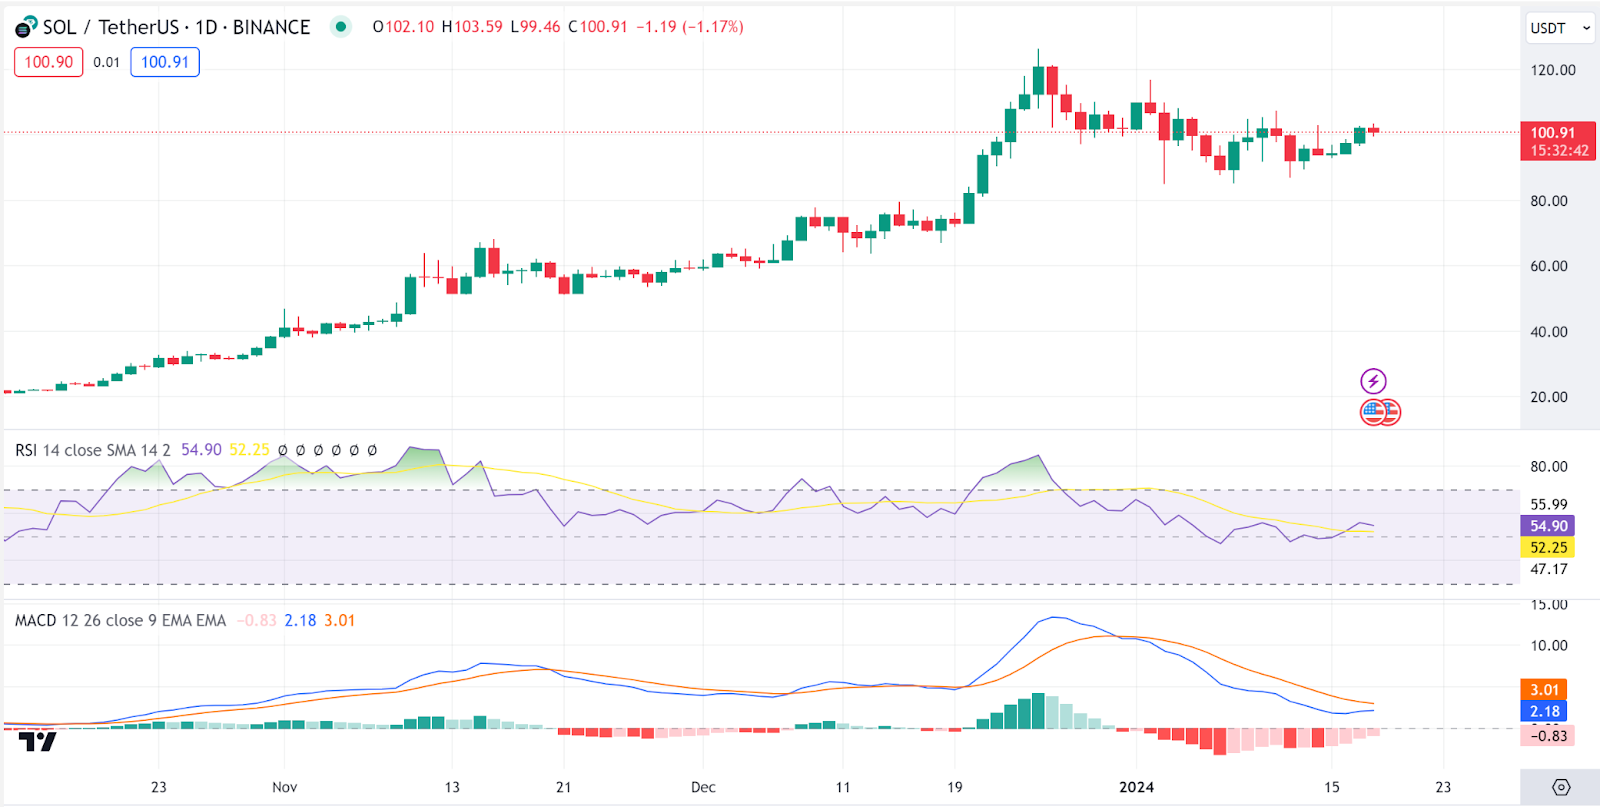
Solana (SOL) is among the gainers today as the Solana price stood at $100.6 as of press time, representing a 3.3% increase in the last 24 hours to bring the weekly rise to 0.4%. The trading volume has jumped by 58% to $3.1B.
An in-depth analysis of the SOL/USDT charts shows a struggle between bulls and bears, as shown by the Relative Strength Index indicator, which is currently on a southern trajectory to show bear action on the Solana price. On the other hand, the MACD indicator is reverting toward the green zone, showing bull action on the Solana price as well.
Sui Price Analysis
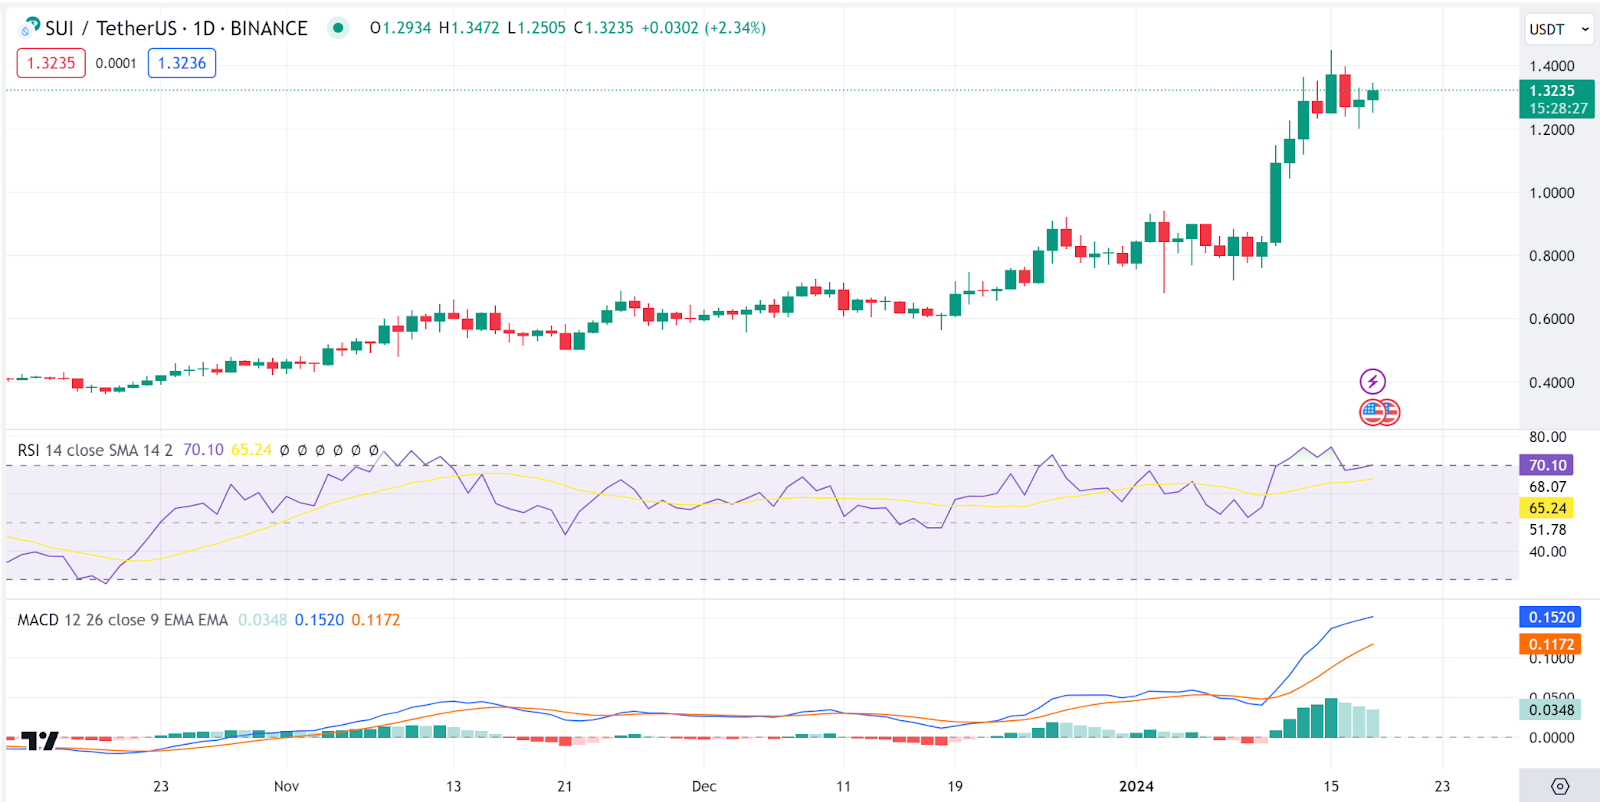
Sui (SUI) is our last gainer of the day as the Sui price stood at $1.33 as of press time, representing a 9.11% increase in the last 24 hours to take the weekly rise to 31%. The trading volume has, however, dropped by 13% to $384M.
Looking at 24-hour SUI/USDT charts also shows a looming correction, as shown by the Relative Strength Index indicator, which is currently overbought, while on the other hand, the MACD indicator is reverting toward the red zone, showing the possibility of a correction on the Sui price.
