- 1 LUFFY token showcased a distribution and faced pressure from the top.
- 2 Buyers were not able to hold out the gains and faced throwback at every spot.
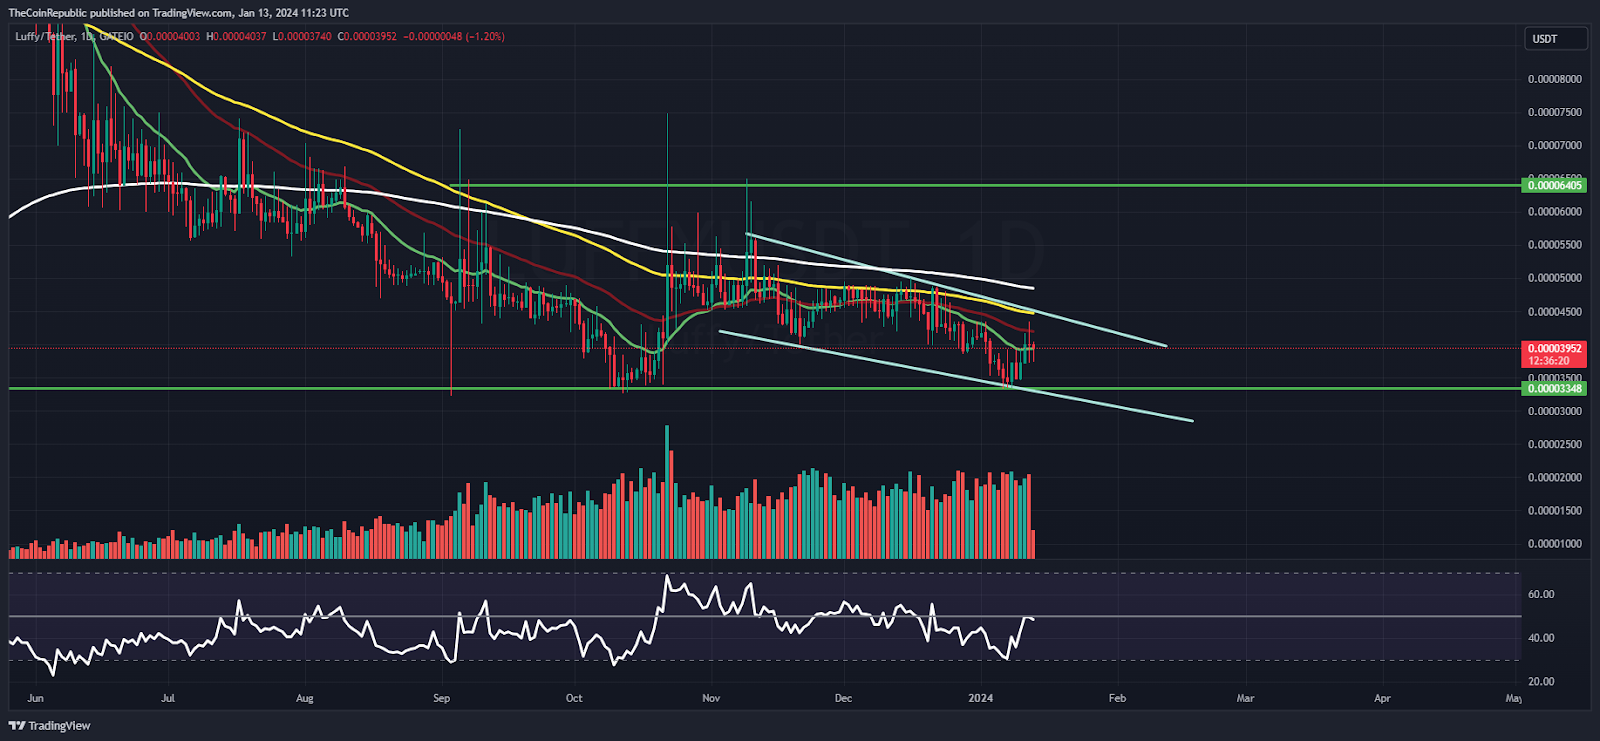
Luffy is an anime token. Luffy’s mission is to become the leader of meme and anime tokens. The LUFFY Token provides its users with a transparent and clear view of the token supply through the Luffy Burn Dashboard, which tracks the real-time burning of tokens. Luffy token showcased a rounding top formation and is taking support multiple times close to the demand zone of $0.00003300.
The Luffy token price is trading below the neutrality and is hovering near the make-or-break zone of $0.0003800, which, if it breaks, sellers will gain strength and may lead Luffy below the support mark of $0.00003500 and may crash the demand zone too.
However, the token is trying to attain the 20-day EMA and is displaying a rebound, but it needs confirmation, too, that the pullback is valid or a fake reversal.
At press time, Luffy Token (LUFFY) trades at $0.00003990 with an intraday drop of 7.26%, showing a rejection from the 20-day EMA. Moreover, the trading volume increased by 0.81% to $33,972, highlighting dull moves. The pair of LUFFY/BTC was noted at 0.000000000952 BTC, while the market cap is $4.06 Million. Analysts are bearish and suggest that the LUFFY price will continue to face volatility and may breach $0.00003000 soon.
LUFFY On Daily Charts Falling Channel Pattern

On the daily charts, the LUFFY token price endured in dragging the gains and was in a downtrend amidst the positive market sentiments. Moreover, the sellers persisted in adding short positions and showcased their legacy, which led to bulls in trouble. In addition to the channel formation, a rounding top pattern signifies the rejection wick near $0.00006400. Afterward, the Luffy price retraced over 45% in the past weeks.
The Momentum Indicator, the relative strength index (RSI) displays the bears’ strength and the curve fails to hold the midline, signifying the selling pressure. Similarly, the MACD indicator showed a bearish crossover, revealing underperformance on the charts.
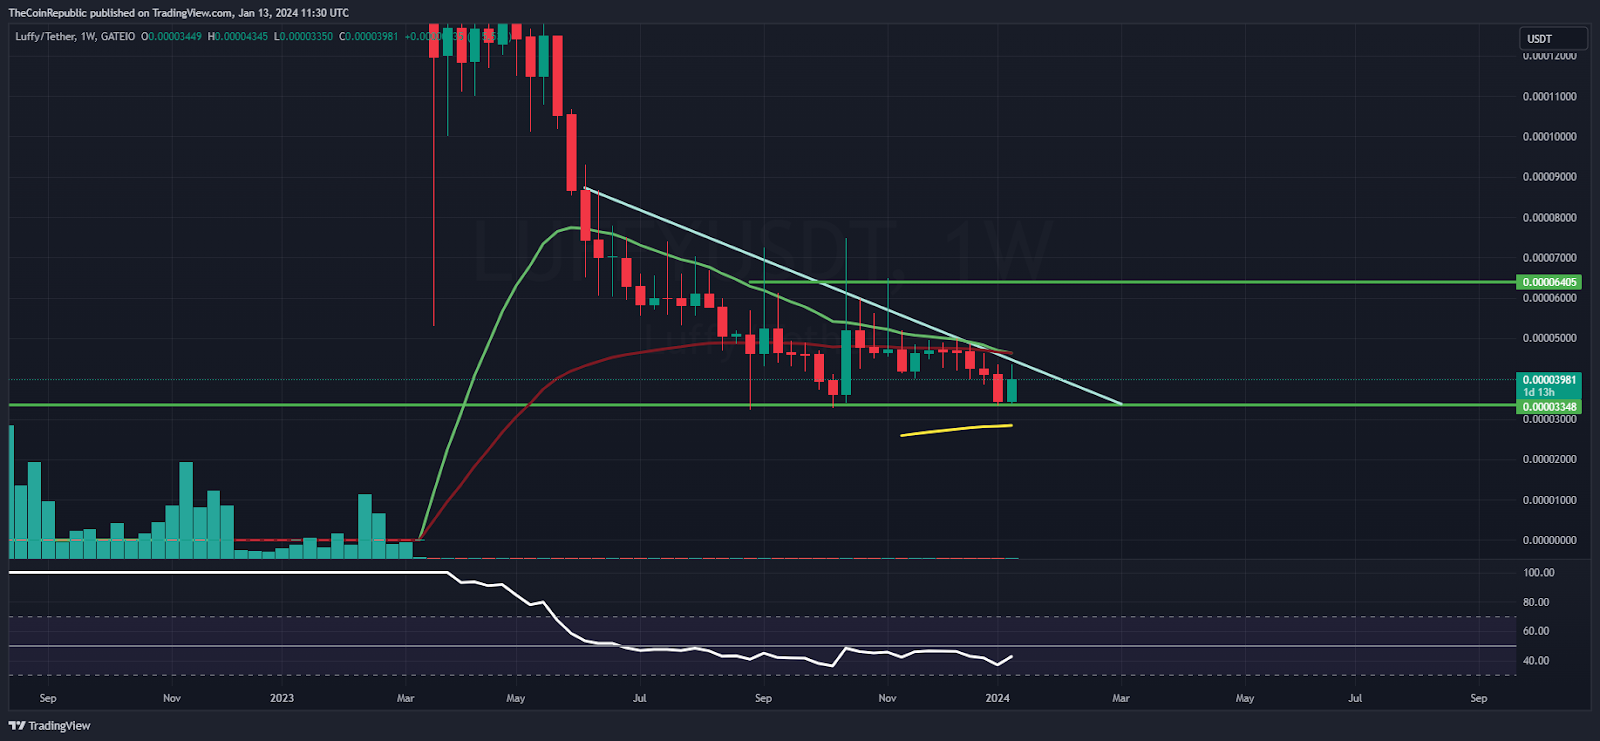
LUFFY On Weekly Charts Heading Toward 100-Day EMA

On the weekly charts, Luffy token failed to scratch the downward-sloping trendline and strived in a downtrend. Furthermore, the trend showcased an unfavorable view, and Luffy token may further slide and will retest the 100-day EMA mark soon. Per the Fib retracement levels, LUFFY price has dragged below the 38.2% zone and is on the verge of the 23.6% zone.
Summary
LUFFY token persisted in forming lower lows and is facing a downward sloping trendline, delivering the down move. Moreover, the price action is bearish, and the Luffy token needs to surpass the 20-day EMA for a rebound. On the contrary, if it slips below $0.00003900, it will drag further toward $0.00003600 soon.
Technical Levels
Support Levels: $0.00003900 and $0.00003600
Resistance Levels: $0.00004200 and $0.00004500
Disclaimer
The views and opinions stated by the author or any other person named in this article are for informational purposes only and do not constitute financial, investment, or other advice. Investing in or trading crypto or stocks comes with a risk of financial loss.
Mr. Pratik chadhokar is an Indian Forex, Cryptocurrencies and Financial Market Advisor and analyst with a background in IT and Financial market Strategist. He specialises in market strategies and technical analysis and has spent over a year as a financial markets contributor and observer. He possesses strong technical analytical skills and is well known for his entertaining and informative analysis of the Financial markets.
 thecoinrepublic.com
