The Cardano (ADA) price bounced this week, possibly in anticipation of the first Cardano Buidler Fest.
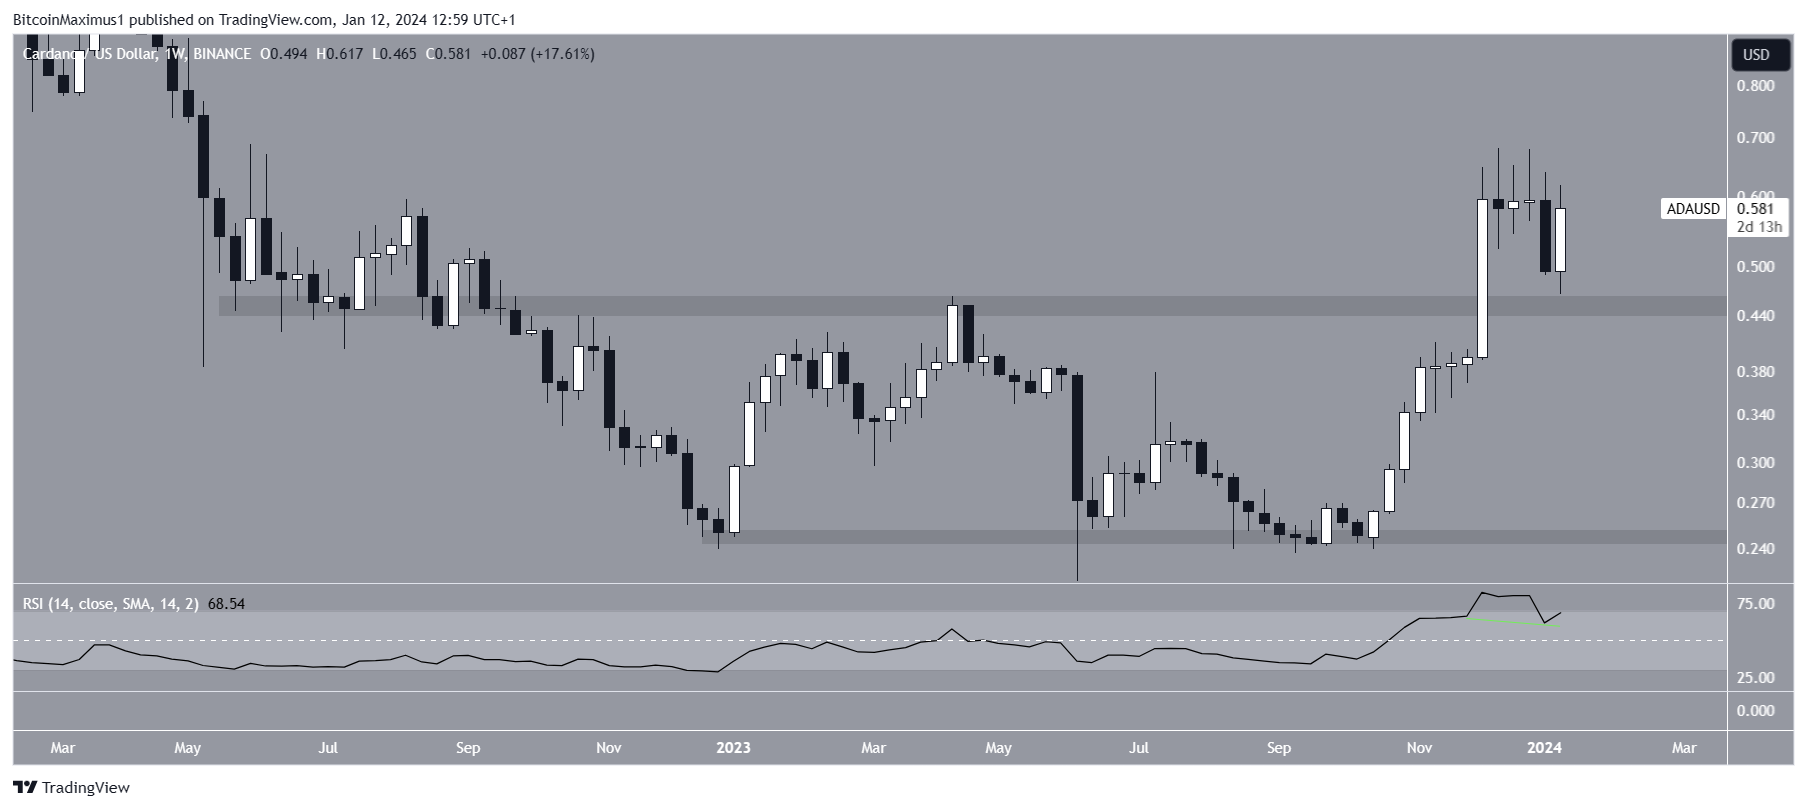
The price trades above a horizontal resistance area but below a short-term descending resistance trend line.
Cardano Breaks Out From Long-Term Range
The weekly time frame technical analysis shows that ADA has traded inside a long-term horizontal range since November 2022. Both the support and resistance of the range have been validated numerous times.
In October 2023, the ADA price began a rapid upward movement and broke out from the range the next month. The increase culminated with a high of $0.68 in December, a new yearly high.
While the price has fallen afterward, it bounced at the top of the range this week, creating a bullish candlestick.
The Cardano Community announced that the first “Buidler Fest” will start today. It is a two-day event where Cardano builders can connect and share. According to the Cardano team:
The Cardano Buidler Fest therefore aims at becoming a recurring event that will bridge that gap between various people involved in the concrete daily work of working with the Cardano and more generally blockchain stack, and provided technology-centric venue to share and discuss things that matter when one wants to be involved in building Cardano.

Market traders use the RSI as a momentum indicator to identify overbought or oversold conditions and to decide whether to accumulate or sell an asset.
Readings above 50 and an upward trend indicate that bulls still have an advantage, whereas readings below 50 suggest the opposite. The weekly RSI gives mixed readings. While the indicator is falling, it is above 50, generating a hidden bullish divergence (green), a sign of trend continuation.
ADA Price Prediction: Where to Next?
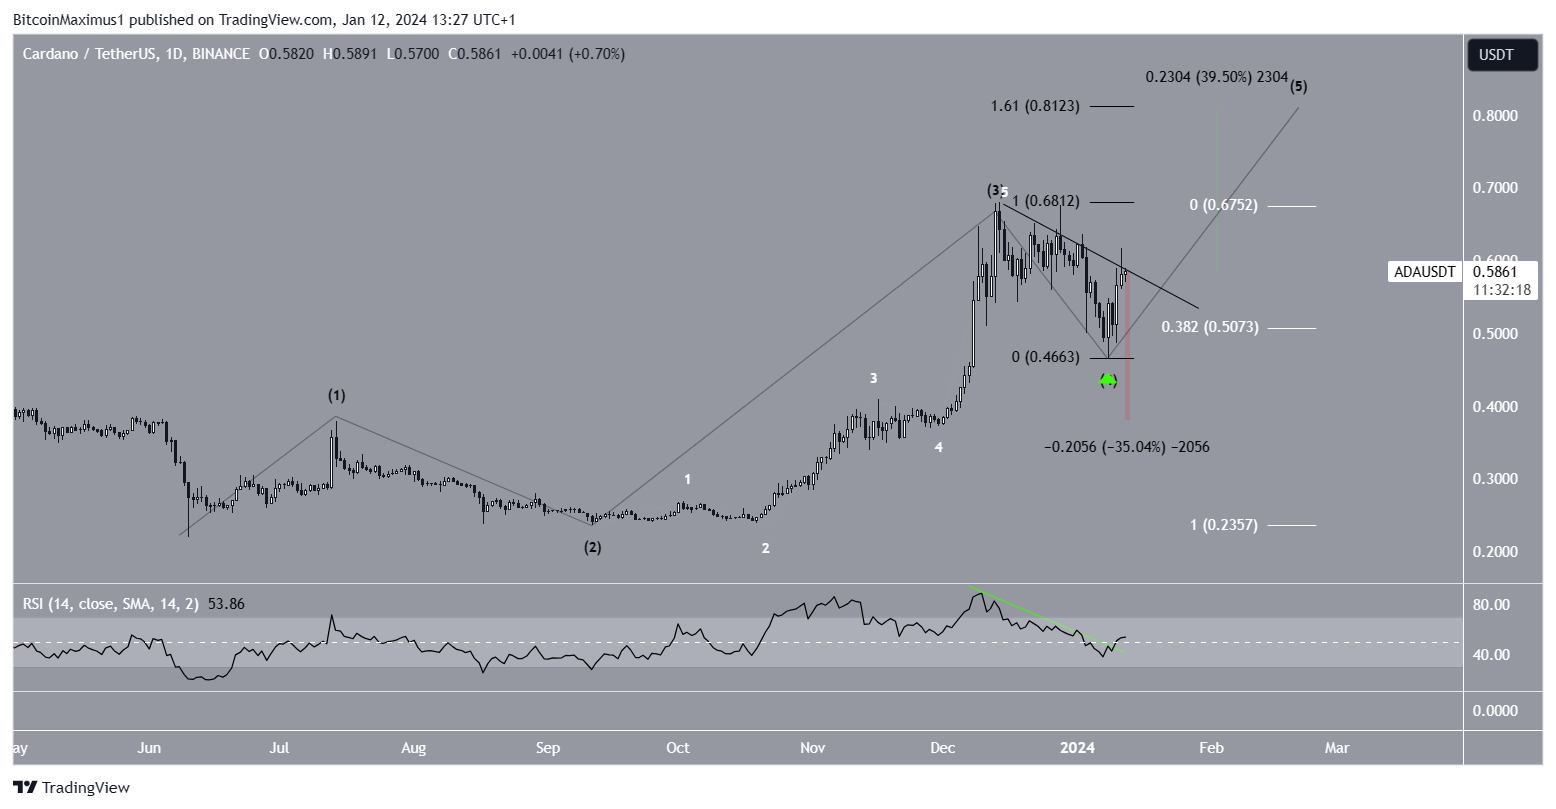
The technical analysis of the daily time frame suggests that the ADA’s upward movement will continue. This is because of the price action, wave count, and RSI readings.
Elliott Wave theory involves the analysis of recurring long-term price patterns and investor psychology to determine the direction of a trend.
The most likely wave count indicates that the ADA price has begun the fifth and final wave of a five-wave increase. Wave four ended with a strong bounce on January 8, which took the price above the 0.382 Fib retracement resistance level.
While the ADA price still follows a descending resistance trend line, the daily RSI has already broken out from its trend line, which often precedes upward movements.
Cryptocurrency analyst, the dApp analyst, also believes that the ADA price will outperform Bitcoin (BTC) this cycle.
If ADA breaks out from its resistance trend line, the first area for a top will be at $0.81, created by the 1.61 external retracement of wave four. This is 40% above the current price.

Despite this bullish ADA price prediction, regression below $0.50 will invalidate the bullish count. This could cause a 35% drop to the closest support at $0.38.
For BeInCrypto’s latest crypto market analysis, click here.
Disclaimer
In line with the Trust Project guidelines, this price analysis article is for informational purposes only and should not be considered financial or investment advice. BeInCrypto is committed to accurate, unbiased reporting, but market conditions are subject to change without notice. Always conduct your own research and consult with a professional before making any financial decisions. Please note that our Terms and Conditions, Privacy Policy, and Disclaimers have been updated.
 beincrypto.com