The Litecoin (LTC) price has fallen since July 2023 and returned to a long-term support level this week.
The price bounced yesterday, creating a bullish candlestick in the daily time frame.
Litecoin Returns to Support
The technical analysis from the weekly time frame shows that the LTC price has fallen since reaching a high of $115 in July 2023. The decrease led to a low of $56 in August.
After a brief bounce and subsequent drop, the LTC price created a higher low last week (green icon).
The Litecoin price bounce validated a long-term ascending support trend line that has been in place since June 2022 and a horizontal area that intermittently acted as both support and resistance.
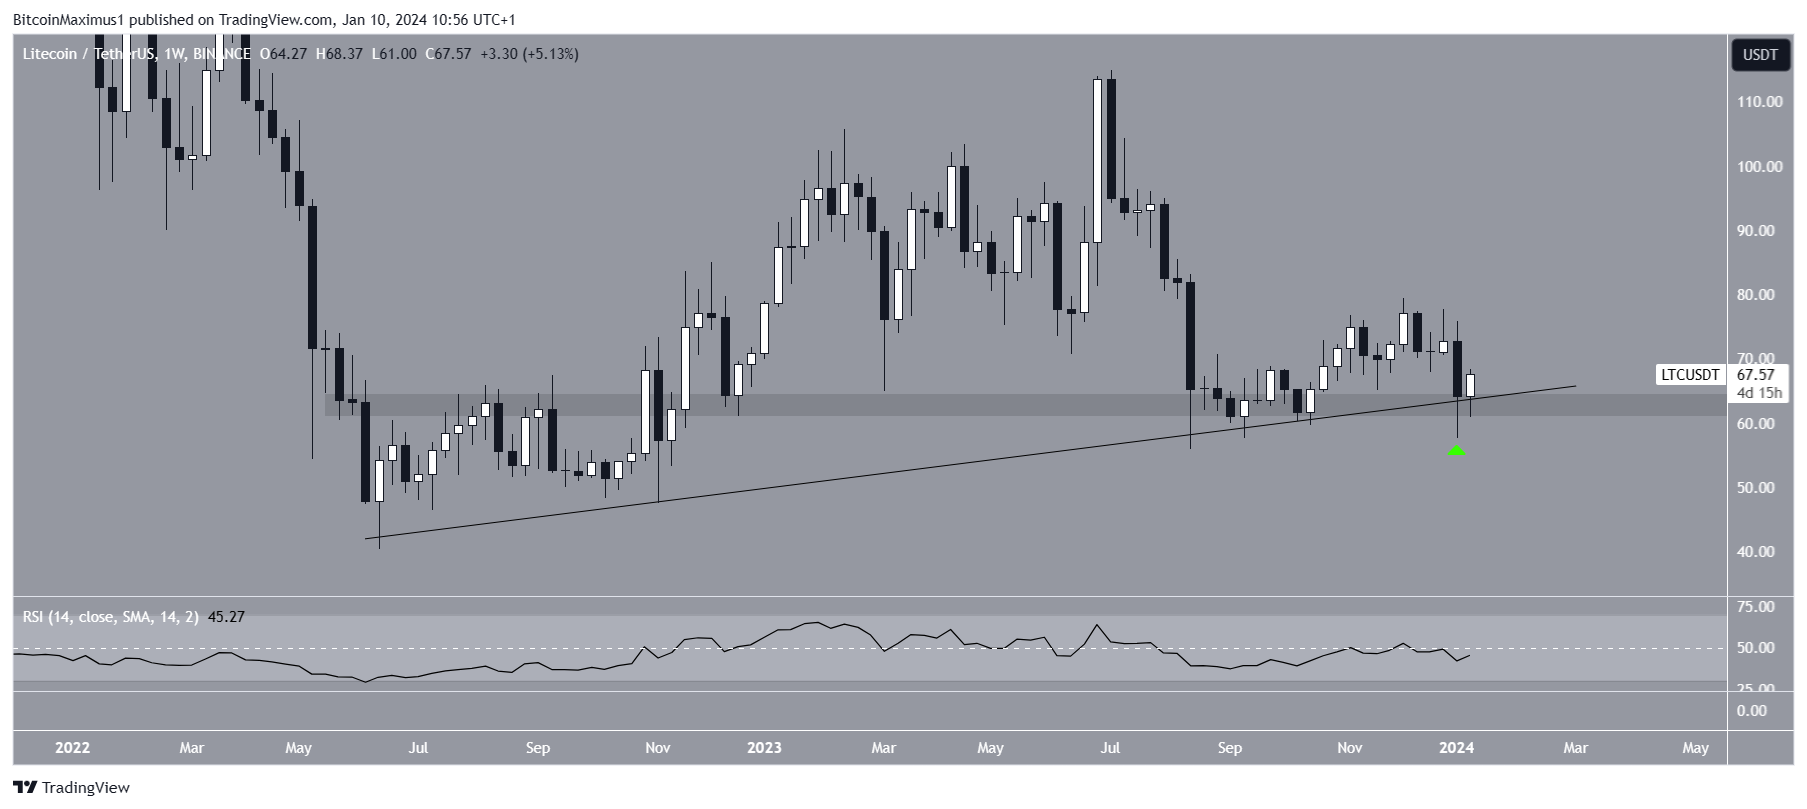
Traders utilize the RSI as a momentum indicator to assess whether a market is overbought or oversold and whether to accumulate or sell an asset.
If the RSI reading is above 50 and the trend is upward, bulls still have an advantage, but if the reading is below 50, the opposite is true. The weekly RSI is at 50, a sign of an undetermined trend.
What Are Analysts Saying?
Cryptocurrency traders and analysts on X have a mixed view of the future LTC price trend.
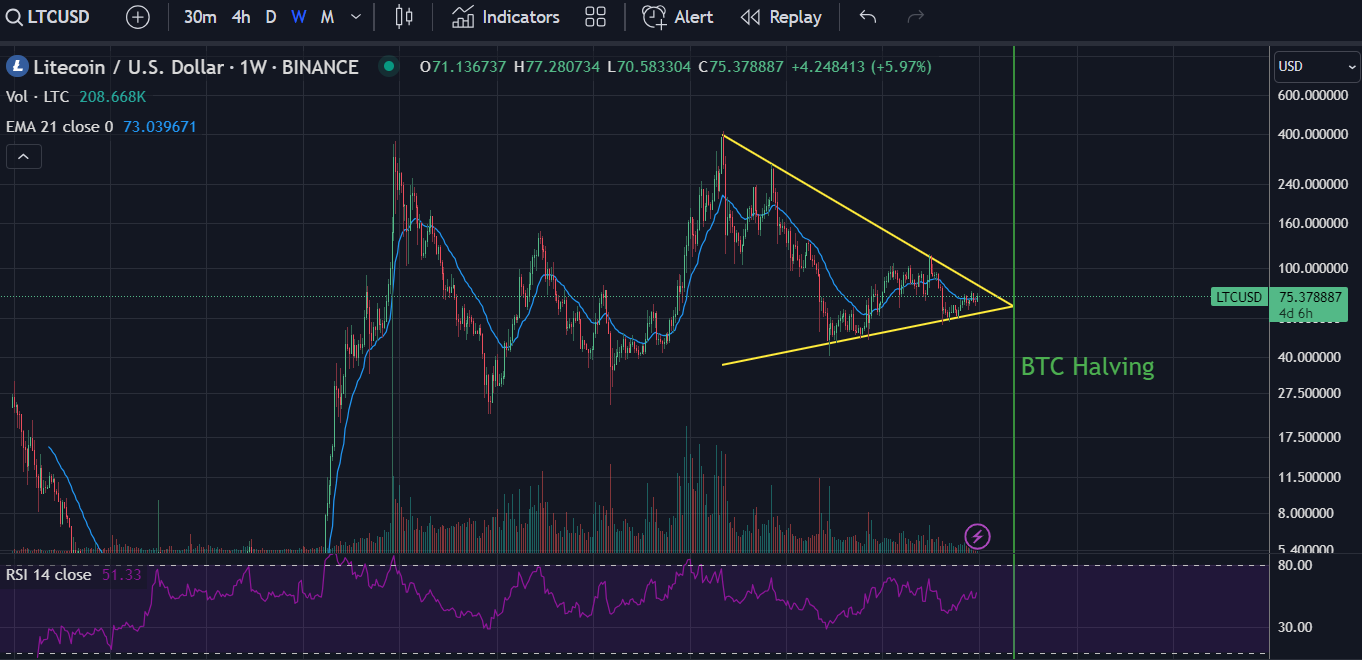
Joao Devesa believes the LTC price will increase significantly soon due to a potential breakout from a long-term pattern.
However, Diamond Hands is bearish. He noted two ascending parallel channels, breakdowns from which are likely to trigger downward movements.
LTC Price Prediction: Further Downside or Trend Reversal?
Similarly to the weekly time frame, the 2-day chart does not confirm the trend’s direction. However, the wave count is leaning bullish. Elliott Wave theory involves the analysis of recurring long-term price patterns and investor psychology to determine the direction of a trend.
The most likely wave count suggests that the price completed a five-wave upward movement and an A-B-C corrective structure starting in June 2022.
If so, Litecoin started another upward movement (white) in September 2023. If these upward movements have the same length, LTC will increase by 80% and reach the next resistance at $122.
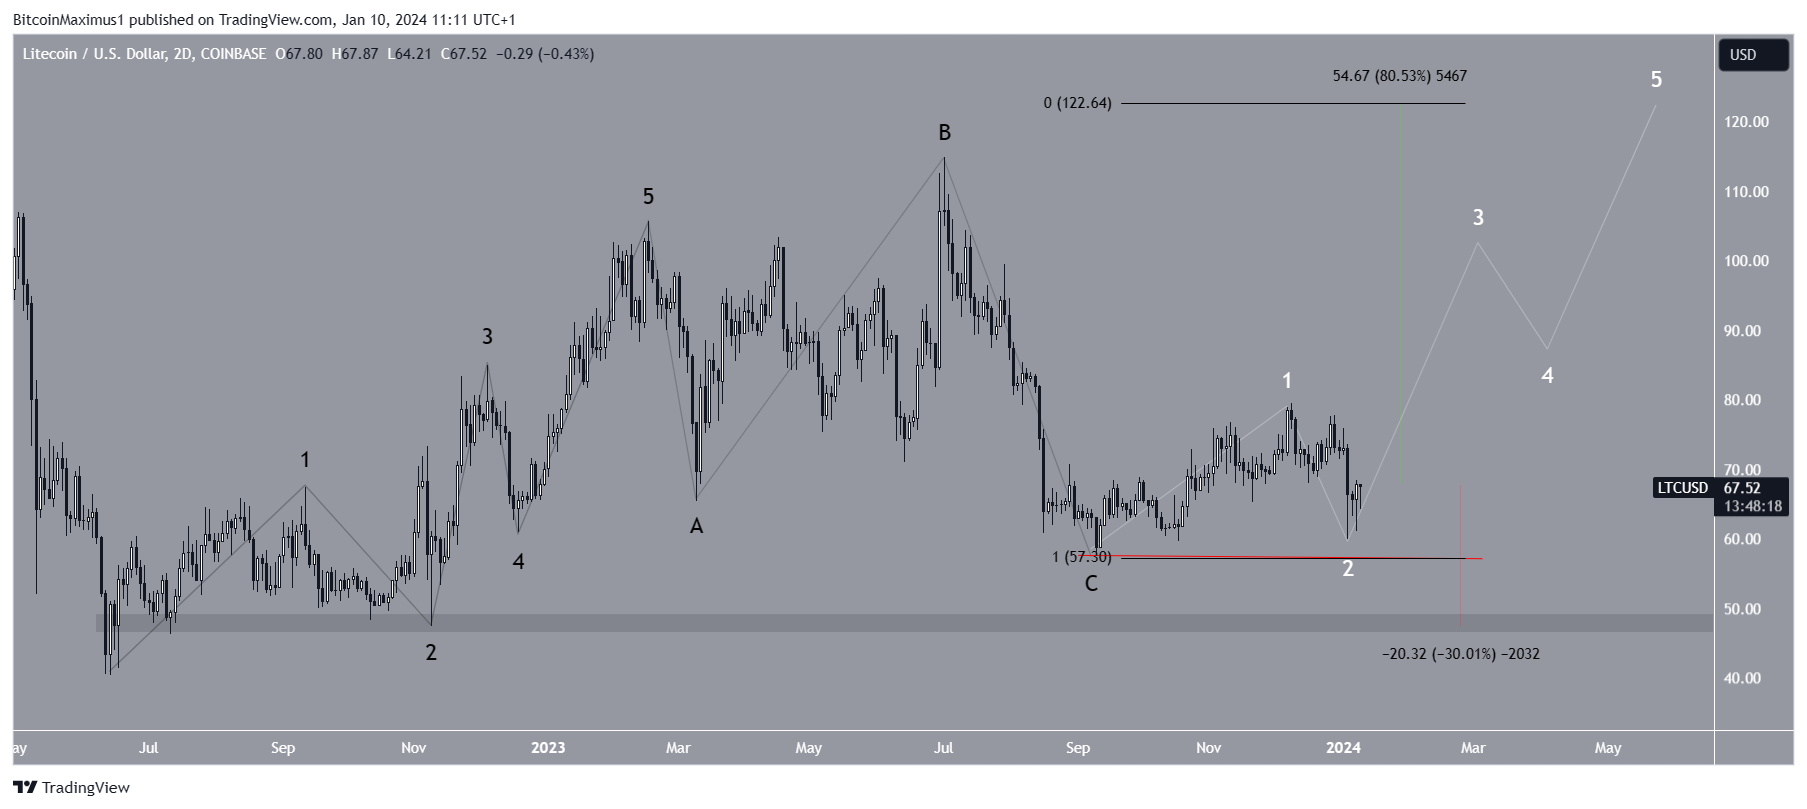
Despite this bullish LTC price prediction, a decrease below the September 2023 low of $57.30 (red) will invalidate the bullish count. Then, LTC could fall 30% to the closest support at $48.
For BeInCrypto’s latest crypto market analysis, click here.